Performance性能
On this page本页内容
Performance Tab“性能”选项卡
To access the real-time server performance view, click the cluster name in the upper left corner and select the Performance tab.要访问实时服务器性能视图,请单击左上角的群集名称,然后选择“性能”选项卡。

Server Stats服务器统计信息
The Performance tab displays various stats:“性能”选项卡显示各种统计信息:
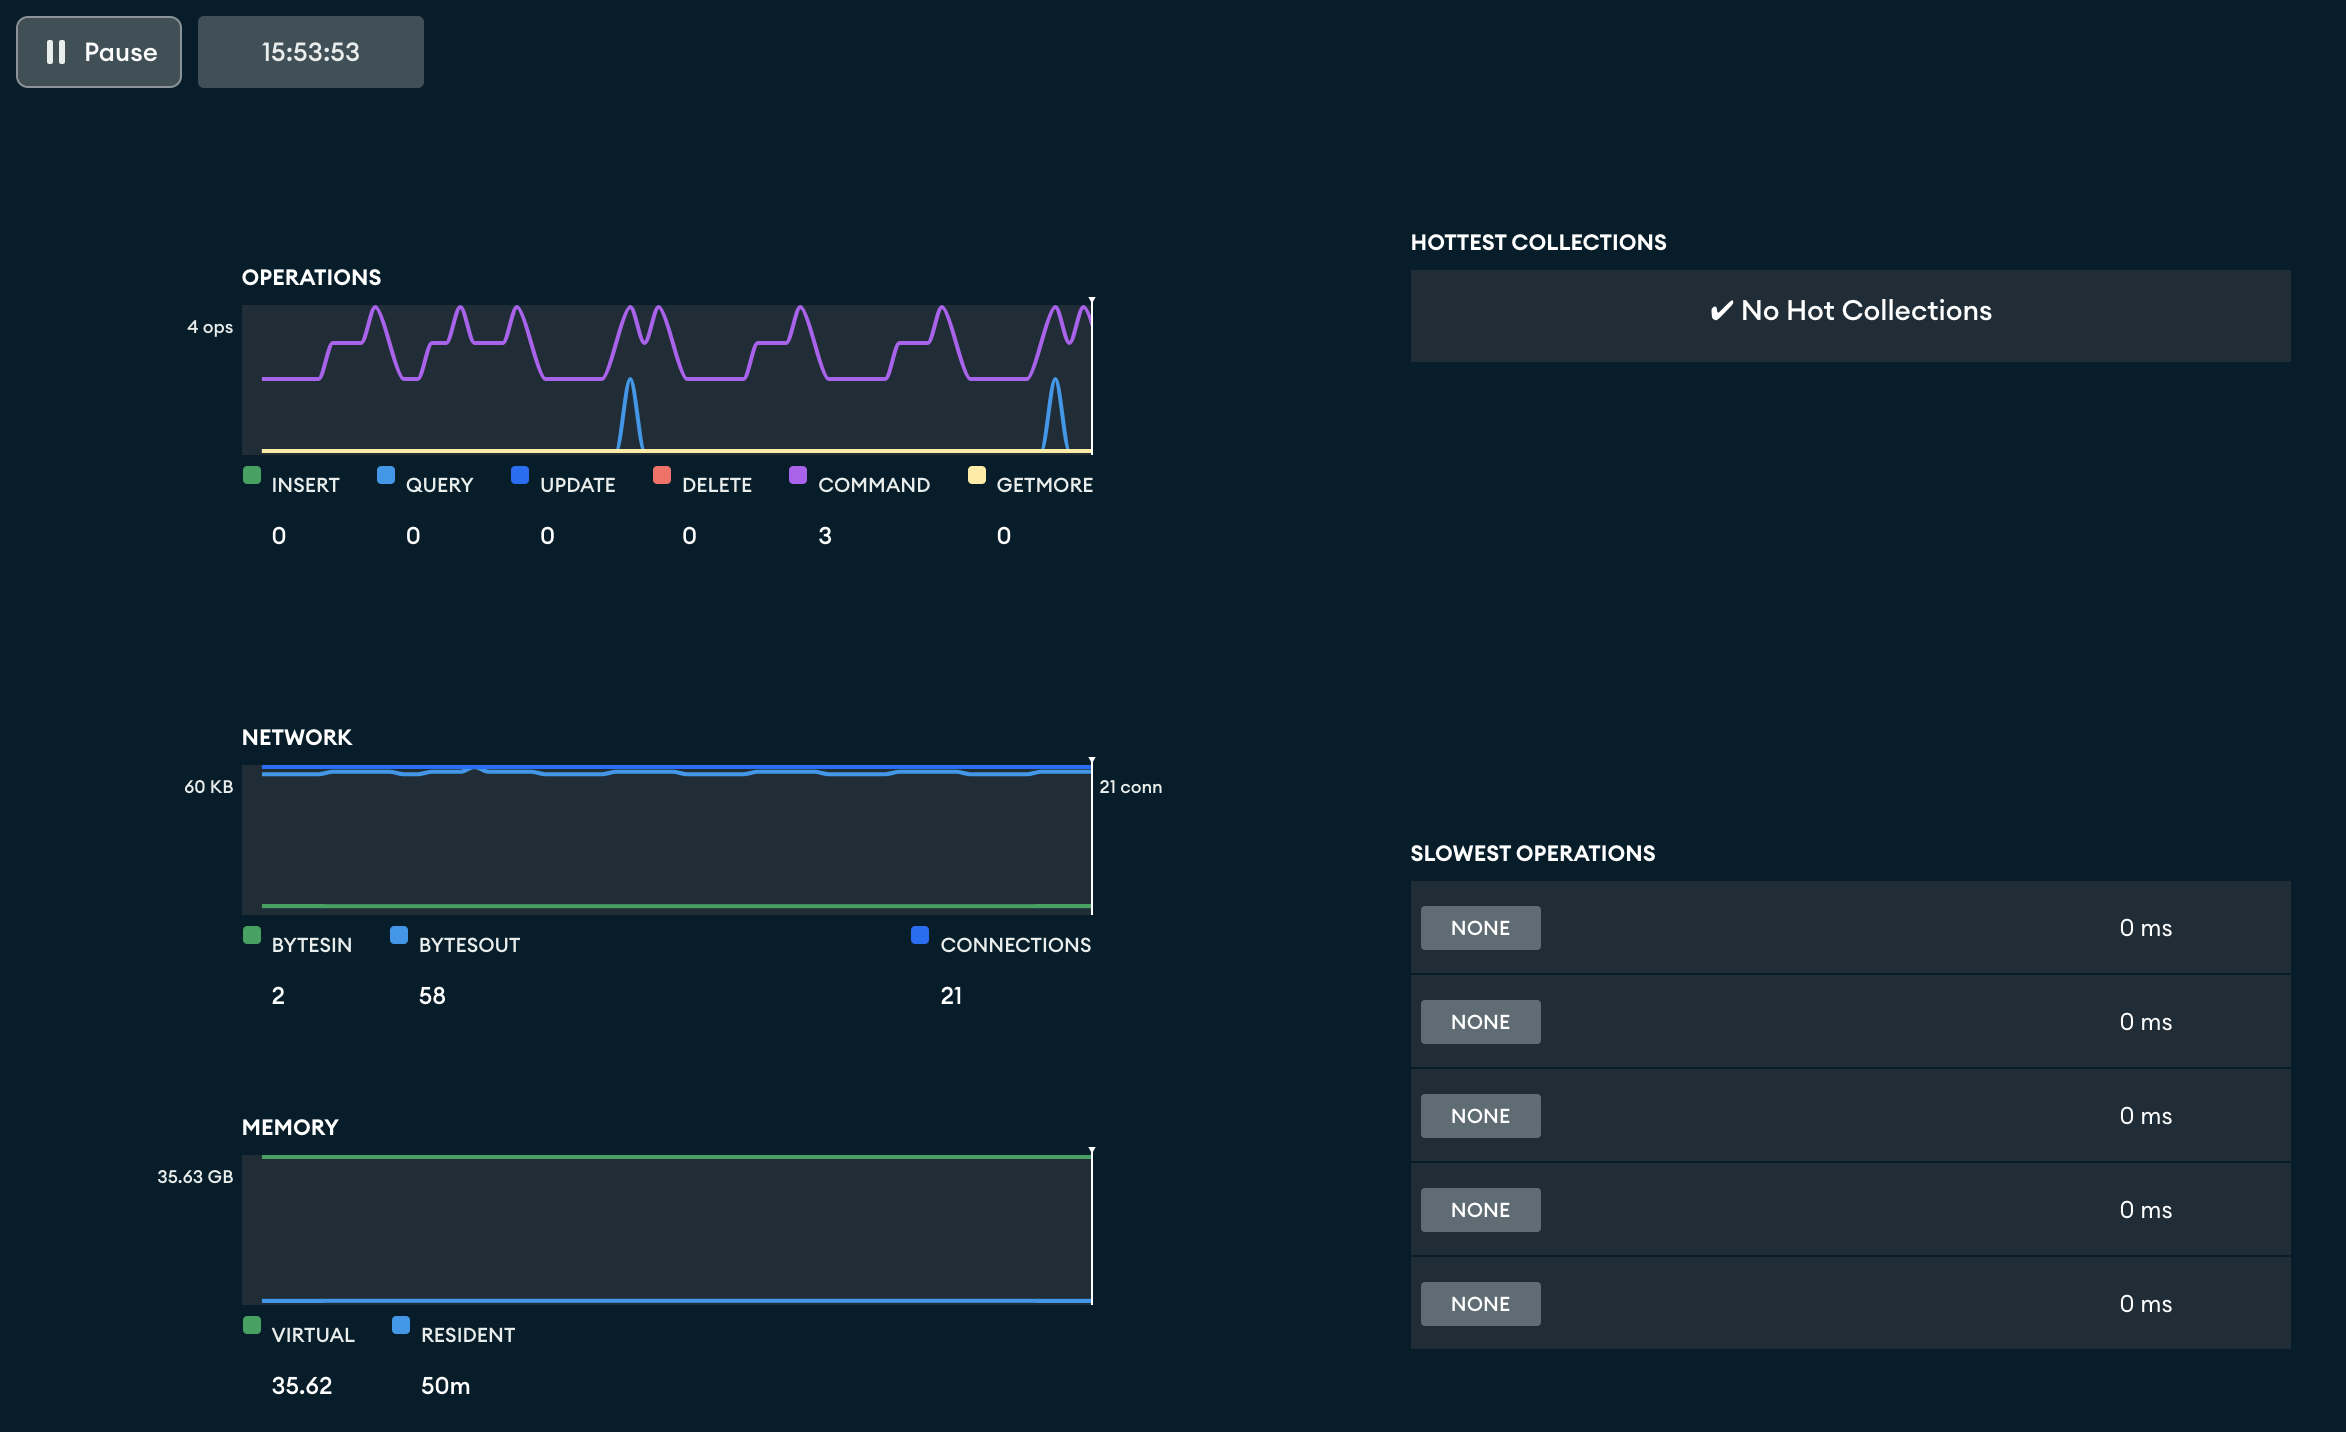
| Chart/Table | |
|---|---|
mongostat. mongostat报告的操作数。mongostat.mongostat。 | |
mongostat. mongostat报告的活动读取、排队读取、活动写入和排队写入的数量。 | |
mongostat. mongostat报告的连接数。 | |
mongostat. mongostat报告的内存统计信息。 | |
mongotop.mongotop报告的活动最多的集合。 | |
db.currentOp()报告的最慢操作。 |
Kill Slow Operations杀死慢速操作
Required Permissions必需的权限
On deployments which require authentication, to kill operations not owned by the user, the user must have access that includes the 在需要身份验证的部署中,要终止非用户所有的操作,用户必须具有包括killop privilege action.killop权限操作在内的访问权限。
You can kill slow operations from the Performance Tab.您可以从“性能”选项卡终止慢速操作。
Pause the Display暂停显示
The Pause button above the graph display pauses the update of the displays only. 图形显示上方的“暂停”按钮仅暂停显示的更新。Pausing the performance tab does not impact the collection of the underlying data. 暂停性能选项卡不会影响基础数据的集合。To restart the display updates, click Play.要重新启动显示更新,请单击“播放”。
Next to the Pause button is a clock which shows the current time while the graphs are updating. “暂停”按钮旁边是一个时钟,它显示图形更新时的当前时间。If the display is paused, the clock shows the time at which the pause began.如果显示暂停,时钟会显示暂停开始的时间。
Limitation限制
The Performance tab is not available if you are connected to a Data Lake.如果连接到数据湖,则“性能”选项卡不可用。