Analyze Your Data Schema分析数据架构
On this page本页内容
Overview概述
The Schema tab provides an overview of the data type and shape of the fields in a particular collection. Databases and collections are visible in the left-side navigation.“架构”选项卡提供特定集合中字段的数据类型和形状的概述。数据库和集合在左侧导航中可见。
The overview is based on sampling the documents in the collection. 概述基于对集合中的文档进行采样。The schema overview may include additional data about the contents of the fields, such as the minimum and maximum values of dates and integers, the frequency of occurrence of particular values, and the cardinality of the data.模式概述可以包括关于字段内容的附加数据,例如日期和整数的最小值和最大值、特定值的出现频率以及数据的基数。
MongoDB has a flexible schema model, which means that some fields may contain different types of data from one document to the next. MongoDB有一个灵活的模式模型,这意味着一些字段可能包含不同类型的数据,从一个文档到下一个文档。For example, a field named 例如,名为address may contain strings and integers in some documents, objects in others, or some combination of all three.address的字段可能在某些文档中包含字符串和整数,在其他文档中包含对象,或者这三者的组合。
In the case of heterogenous fields, the Schema tab shows a breakdown of the various data types contained within the field with the percentage of each data type represented.在异构字段的情况下,“架构”选项卡显示字段中包含的各种数据类型的细分,以及所表示的每个数据类型的百分比。
The Schema tab shows size information about the “架构”选项卡在顶部显示有关test.restaurants collection at the top, including the total number of documents in the collection, the average document size, and the total disk space occupied by the collection.test.restaurants集合的大小信息,包括集合中文档的总数、平均文档大小以及集合占用的总磁盘空间。
The following fields are shown with details:以下字段显示了详细信息:
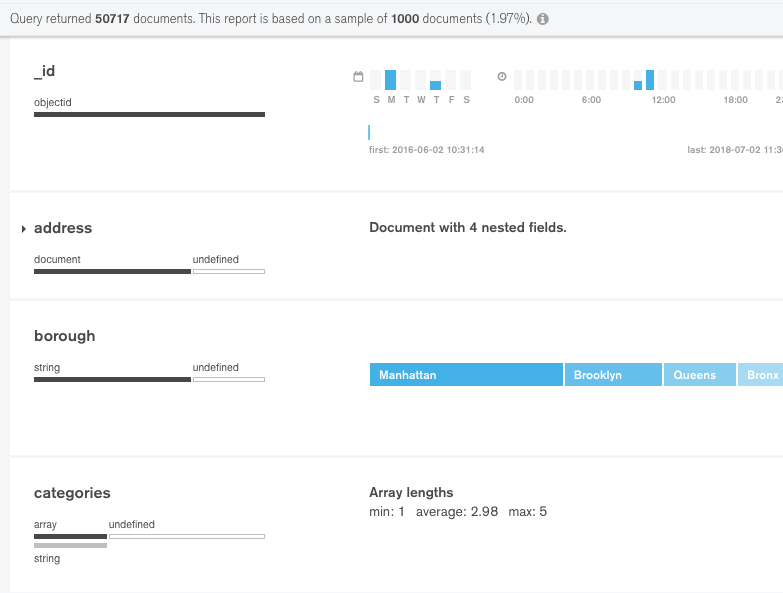
The_idfield is an ObjectId._id字段是一个ObjectId。Each ObjectId contains a timestamp, so Compass displays the range of creation times for the sampled documents.每个ObjectId都包含一个时间戳,因此Compass显示采样文档的创建时间范围。Theaddressfield contains four nested fields.address字段包含四个嵌套字段。You can expand the field panel to see analyses of each of the nested fields.可以展开字段面板以查看对每个嵌套字段的分析。Theboroughfield contains a string indicating the borough in which the restaurant is located.borough字段包含一个字符串,指示餐厅所在的区域。The cardinality is low enough that Compass can provide a graded bar of the field contents, with the most-frequently occurring string on the left.基数足够低,Compass可以提供字段内容的分级条,最频繁出现的字符串在左边。Thecategoriesfield contains arrays of strings.categories字段包含字符串数组。The analysis shows the minimum, maximum, and average array lengths.分析显示了最小、最大和平均数组长度。
Query Bar查询栏
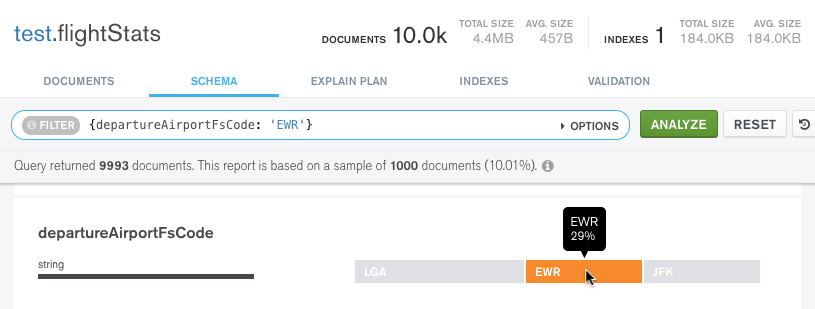
Using the query bar in the Schema tab, you can create a query filter to limit your result set. 使用“架构”选项卡中的查询栏,可以创建一个查询筛选器来限制结果集。Click the Options button to specify query options, such as the particular fields to display and the number of results to return.单击“选项”按钮可指定查询选项,例如要显示的特定字段和要返回的结果数。
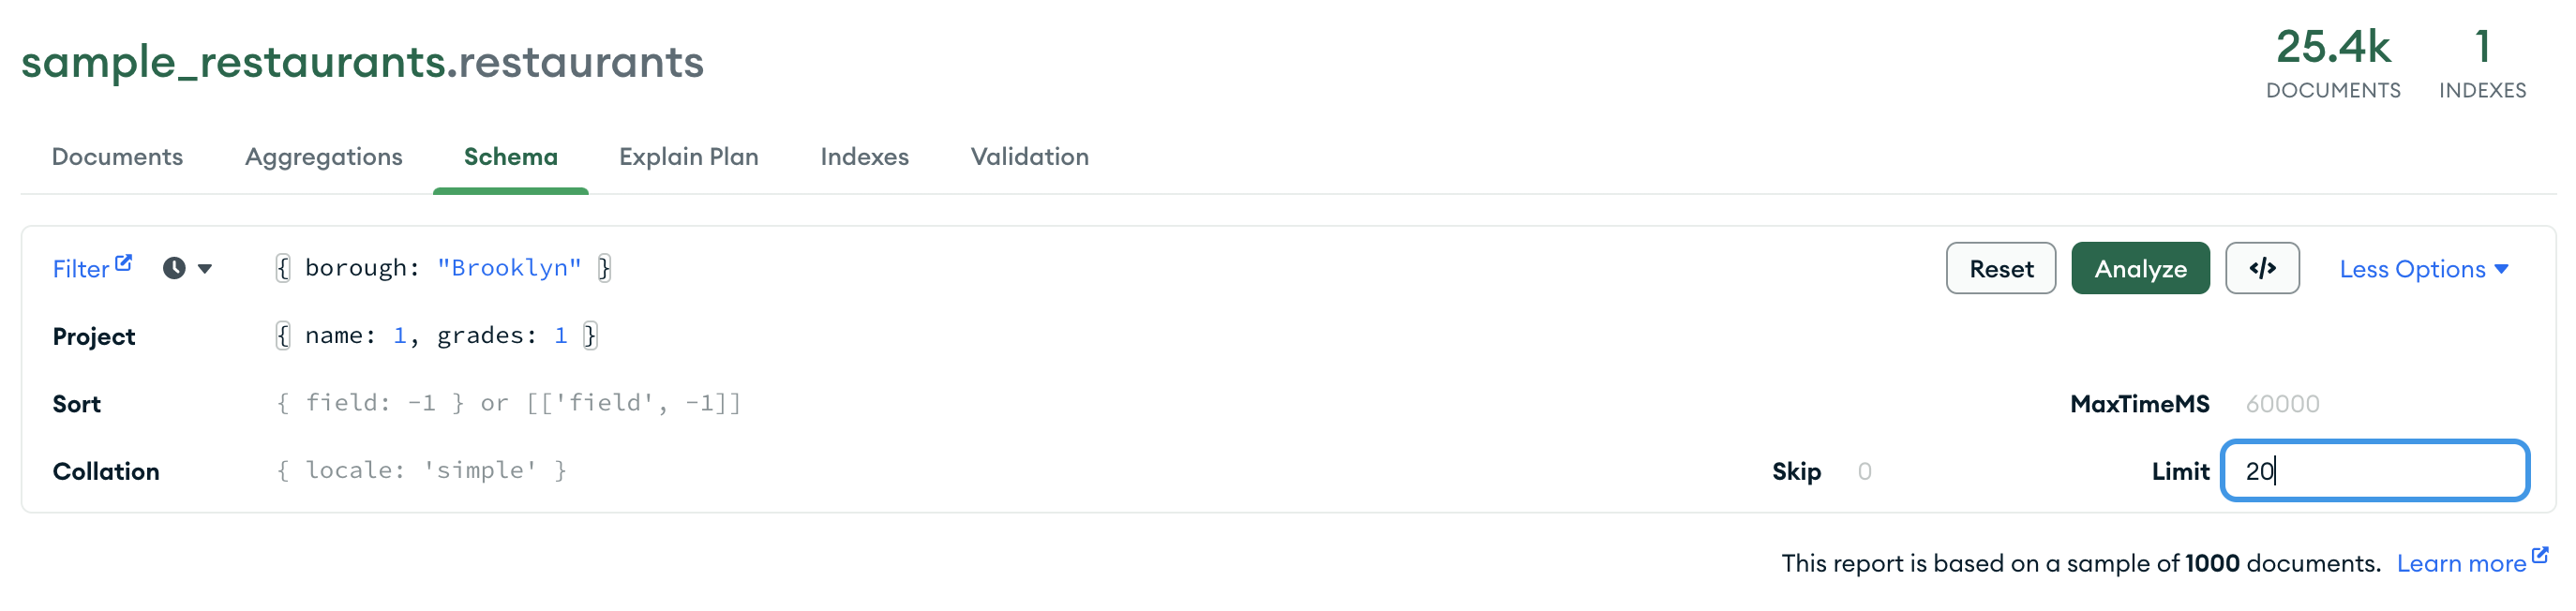
In the Schema tab, you can also use the Query Builder to enter a query into the query bar.在“架构”选项卡中,还可以使用查询生成器在查询栏中输入查询。
Field Descriptions字段说明
For each field, Compass displays summary information about the data type or types the field contains and the range of values. 对于每个字段,Compass都会显示有关字段包含的一种或多种数据类型和值范围的摘要信息。Depending on the data type and the level of cardinality, Compass displays histograms, graded bars, geographical maps, and sample data to provide a sense of the shape and scope of the data contained in each field.根据数据类型和基数级别,Compass显示直方图、分级条、地理地图和样本数据,以提供每个字段中包含的数据的形状和范围。
Field with a Single Data Type具有单一数据类型的字段
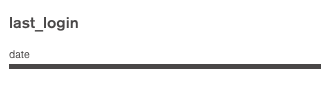
Below is an example of the data type summary for a field called 下面是一个名为last_login which contains data of type date.last_login的字段的date类型摘要示例,该字段包含日期类型的数据。
Field with Multiple Data Types具有多种数据类型的字段
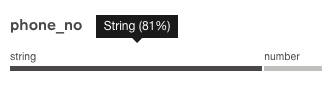
For fields that contain multiple data types, Compass displays a percentage breakdown of the various data types across documents. 对于包含多种数据类型的字段,Compass会显示文档中各种数据类型的百分比细分。In the example below, the chart shows the contents of a field called 在下面的示例中,图表显示了一个名为phone_no in which 81% of documents are of type string, and the remaining 19% are of type number.phone_no的字段的内容,其中81%的文档是string类型,其余19%是number类型。
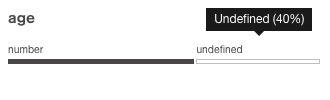
Missing Field缺少字段
If a collection contains documents in which not all fields contain a value, the missing values display as 如果集合包含的文档中并非所有字段都包含值,则缺少的值将显示为undefined. undefined。In the example below, the field 在下面的示例中,字段age has no recorded value in 40% of the sampled documents.age在40%的采样文档中没有记录值。
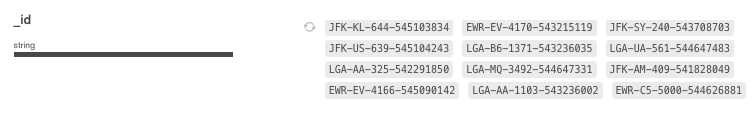
Strings字符串
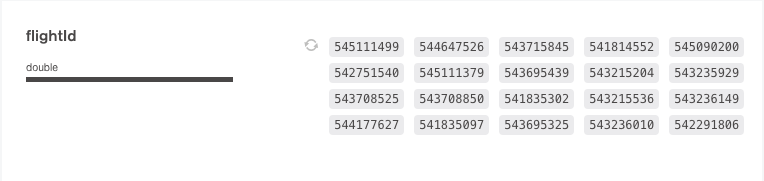
Strings can appear in three different ways. 字符串可以以三种不同的方式出现。If there are entirely unique strings in a field, Compass shows a random selection of string values from the specified field. 如果字段中有完全唯一的字符串,Compass会显示从指定字段中随机选择的字符串值。Click the circular refresh icon to see a new set of randomly selected values from the field.单击循环刷新图标以查看字段中随机选择的一组新值。
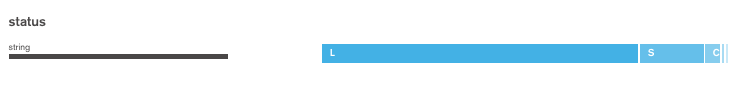
If there are only a few different string values, Compass shows the strings in a single graded bar which shows the percentage of the population of the string values.如果只有几个不同的字符串值,Compass会在单个分级条中显示字符串,该分级条显示字符串值的总体百分比。
If there are multiple string values with some duplicates, Compass shows a histogram indicating the frequency of each string found within the field.如果存在多个重复的字符串值,Compass会显示一个直方图,指示字段中每个字符串的频率。
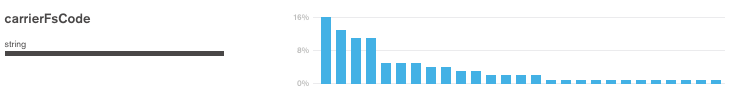
Move the mouse over each bar to display a tooltip which shows the value of the string.将鼠标移动到每个栏上,可以显示一个工具提示,其中显示字符串的值。
Numbers数字
Numbers are similar to strings in their representation. Unique numbers are shown in the following manner:数字在表示形式上与字符串相似。唯一数字以以下方式显示:
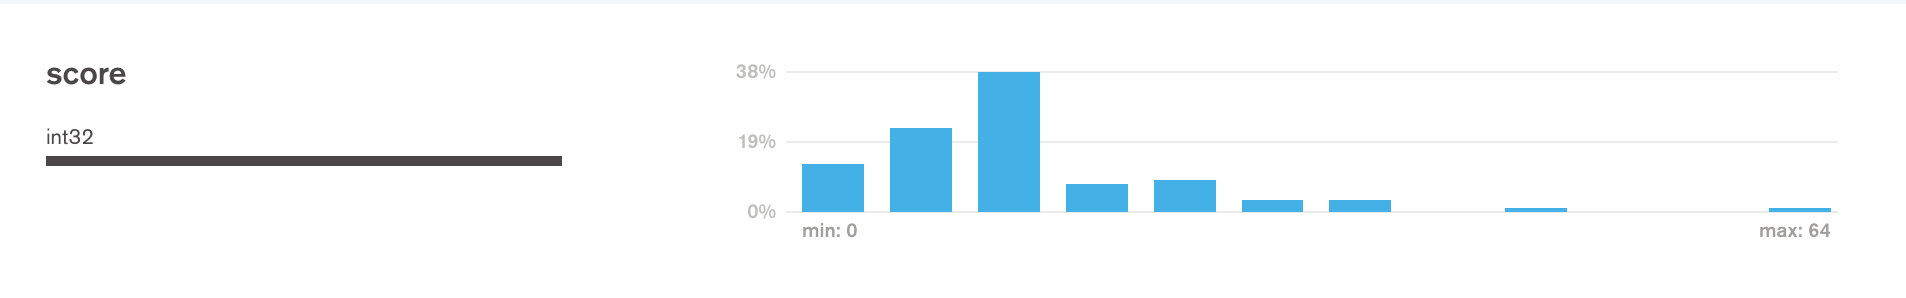
Duplicate numbers are shown in a histogram that indicates their frequency:重复的数字显示在直方图中,表示其频率:
Dates and ObjectIDs日期和对象ID
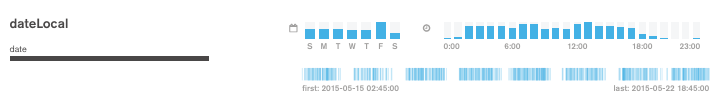
Fields that represent dates (and fields that contain the ObjectID data type, which includes a timestamp) are shown across multiple bar charts. 表示日期的字段(以及包含ObjectID数据类型(包括时间戳)的字段)显示在多个条形图中。The two charts on the top row represent the day of the week and time of day of the timestamp value.顶行的两个图表表示时间戳值的星期几和时间。
The single chart on the bottom shows the first and last timestamp value, and the vertical lines represent the distribution of the timestamp across the range of first to last.底部的单个图表显示了第一个和最后一个时间戳值,竖线表示时间戳在从第一个到最后一个的范围内的分布。
Embedded Documents and Arrays嵌入式文档和数组
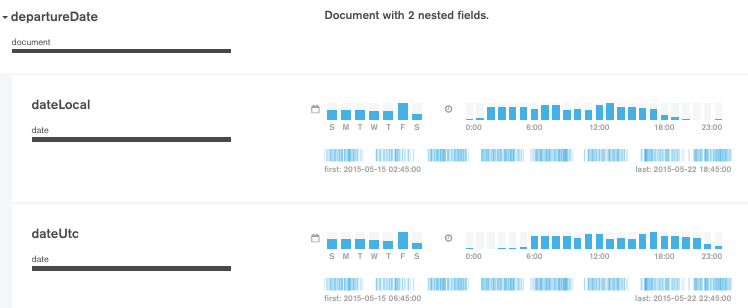
Fields that contain a sub-document or an array are displayed with a small triangle next to them and a visual representation of the data contained within the sub-document or array.包含子文档或数组的字段旁边会显示一个小三角形,以及子文档或数组中包含的数据的可视化表示。

Click on the triangle to expand the field and view the embedded documents:单击三角形展开字段并查看嵌入的文档:
GeoJSON and [longitude,latitude] Arrays
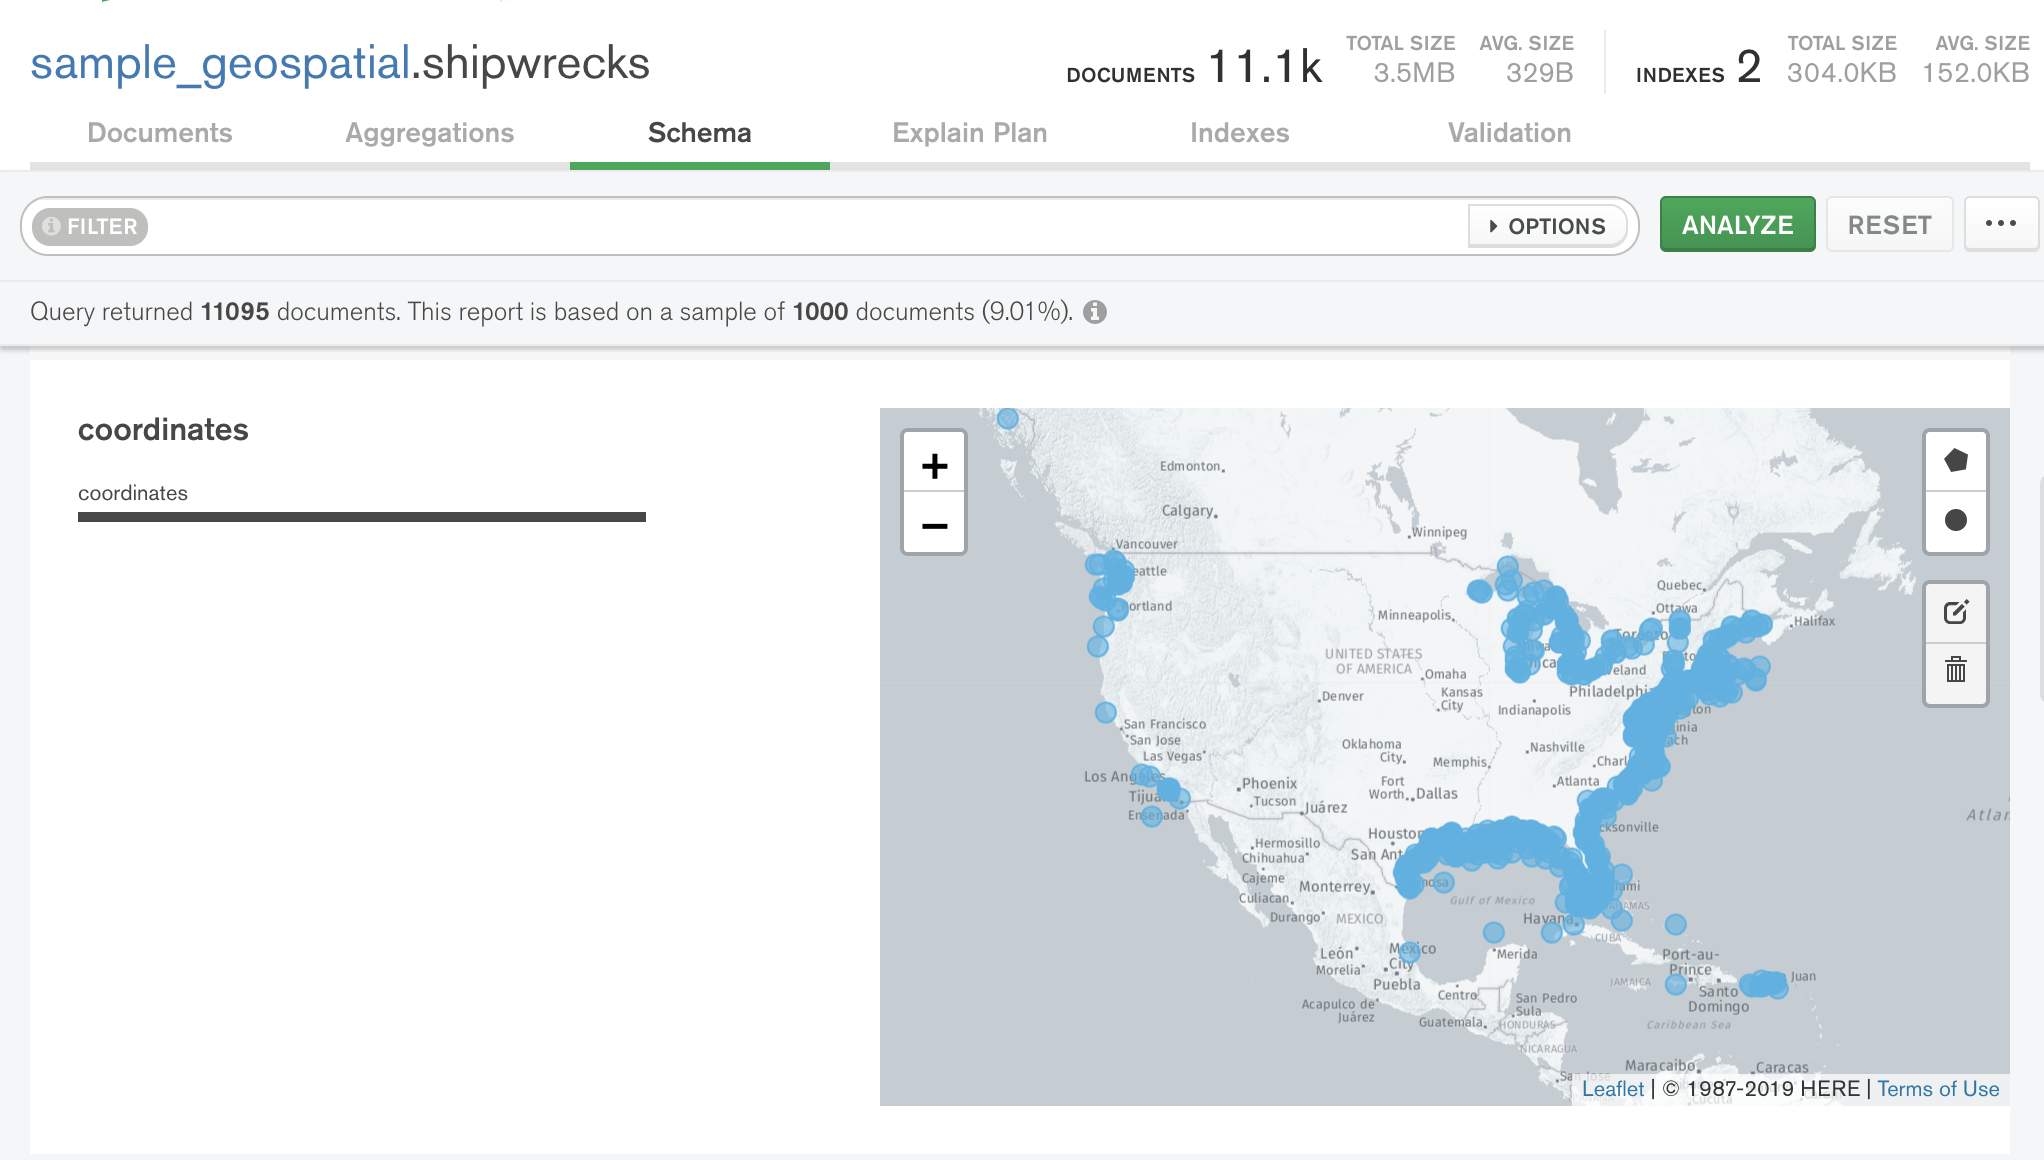
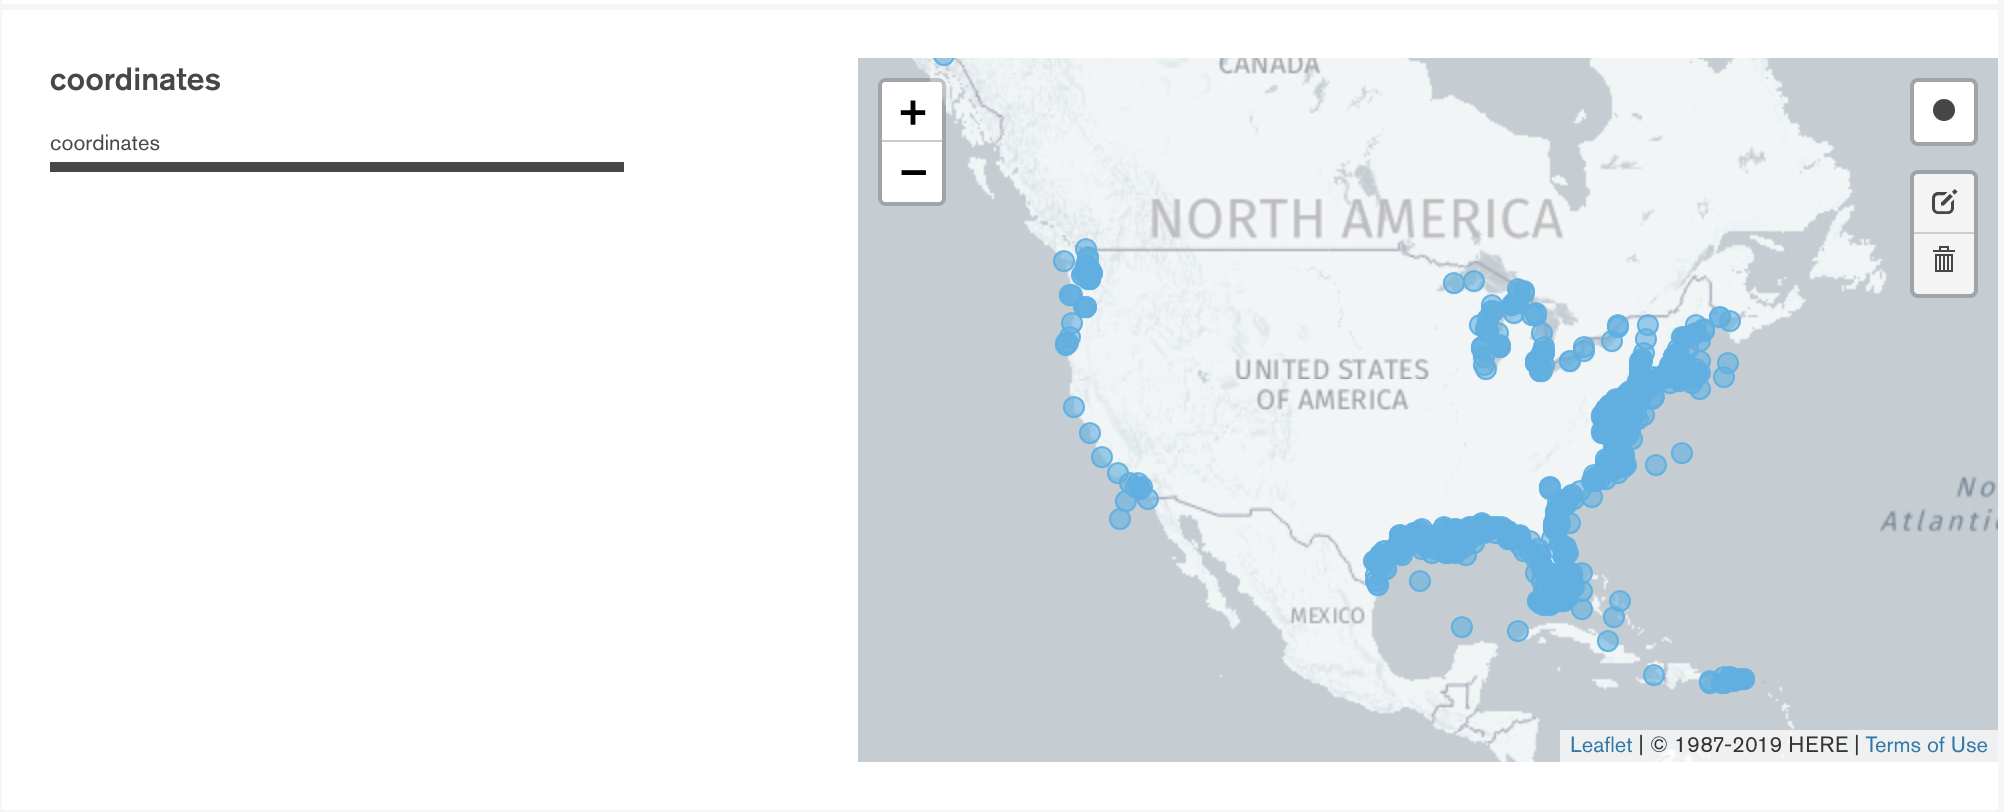
Fields that contain GeoJSON data or 包含GeoJSON数据或[longitude,latitude] arrays are displayed with interactive maps. [longitude,latitude]数组的字段与交互式地图一起显示。For more information on interacting with location data in Compass, see Analyze Location Data.有关在Compass中与位置数据交互的详细信息,请参阅分析位置数据。
Third party mapping services are not available in Compass Isolated Edition.Compass独立版中不提供第三方映射服务。
View Charts of Mixed Types查看混合类型的图表
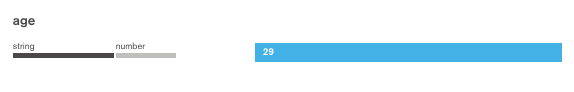
If a field has mixed types, you can view different charts of each type by clicking on the 如果字段具有混合类型,则可以通过单击type field. type字段来查看每种类型的不同图表。In the example below, the 在下面的示例中,age field shows the values that are strings:age字段显示字符串形式的值:
Clicking on the 单击number type causes the chart to show its numeric data:number类型会使图表显示其数字数据:

Query Builder查询生成器
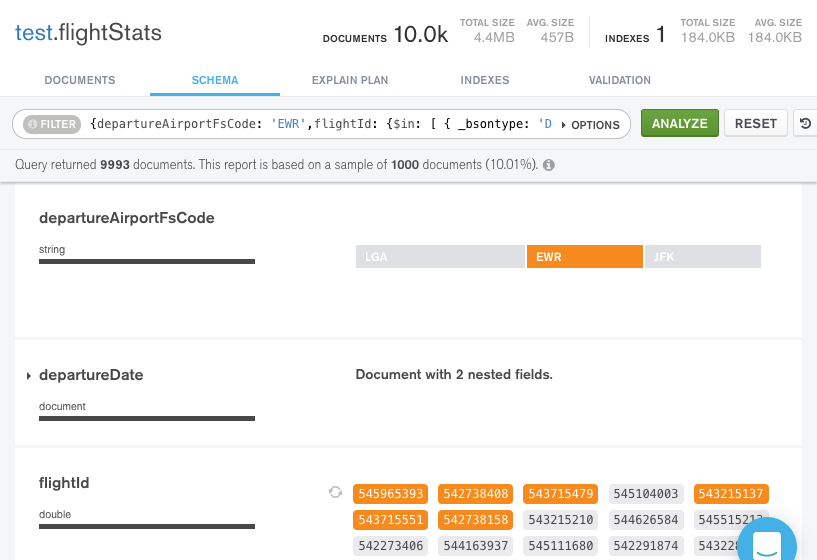
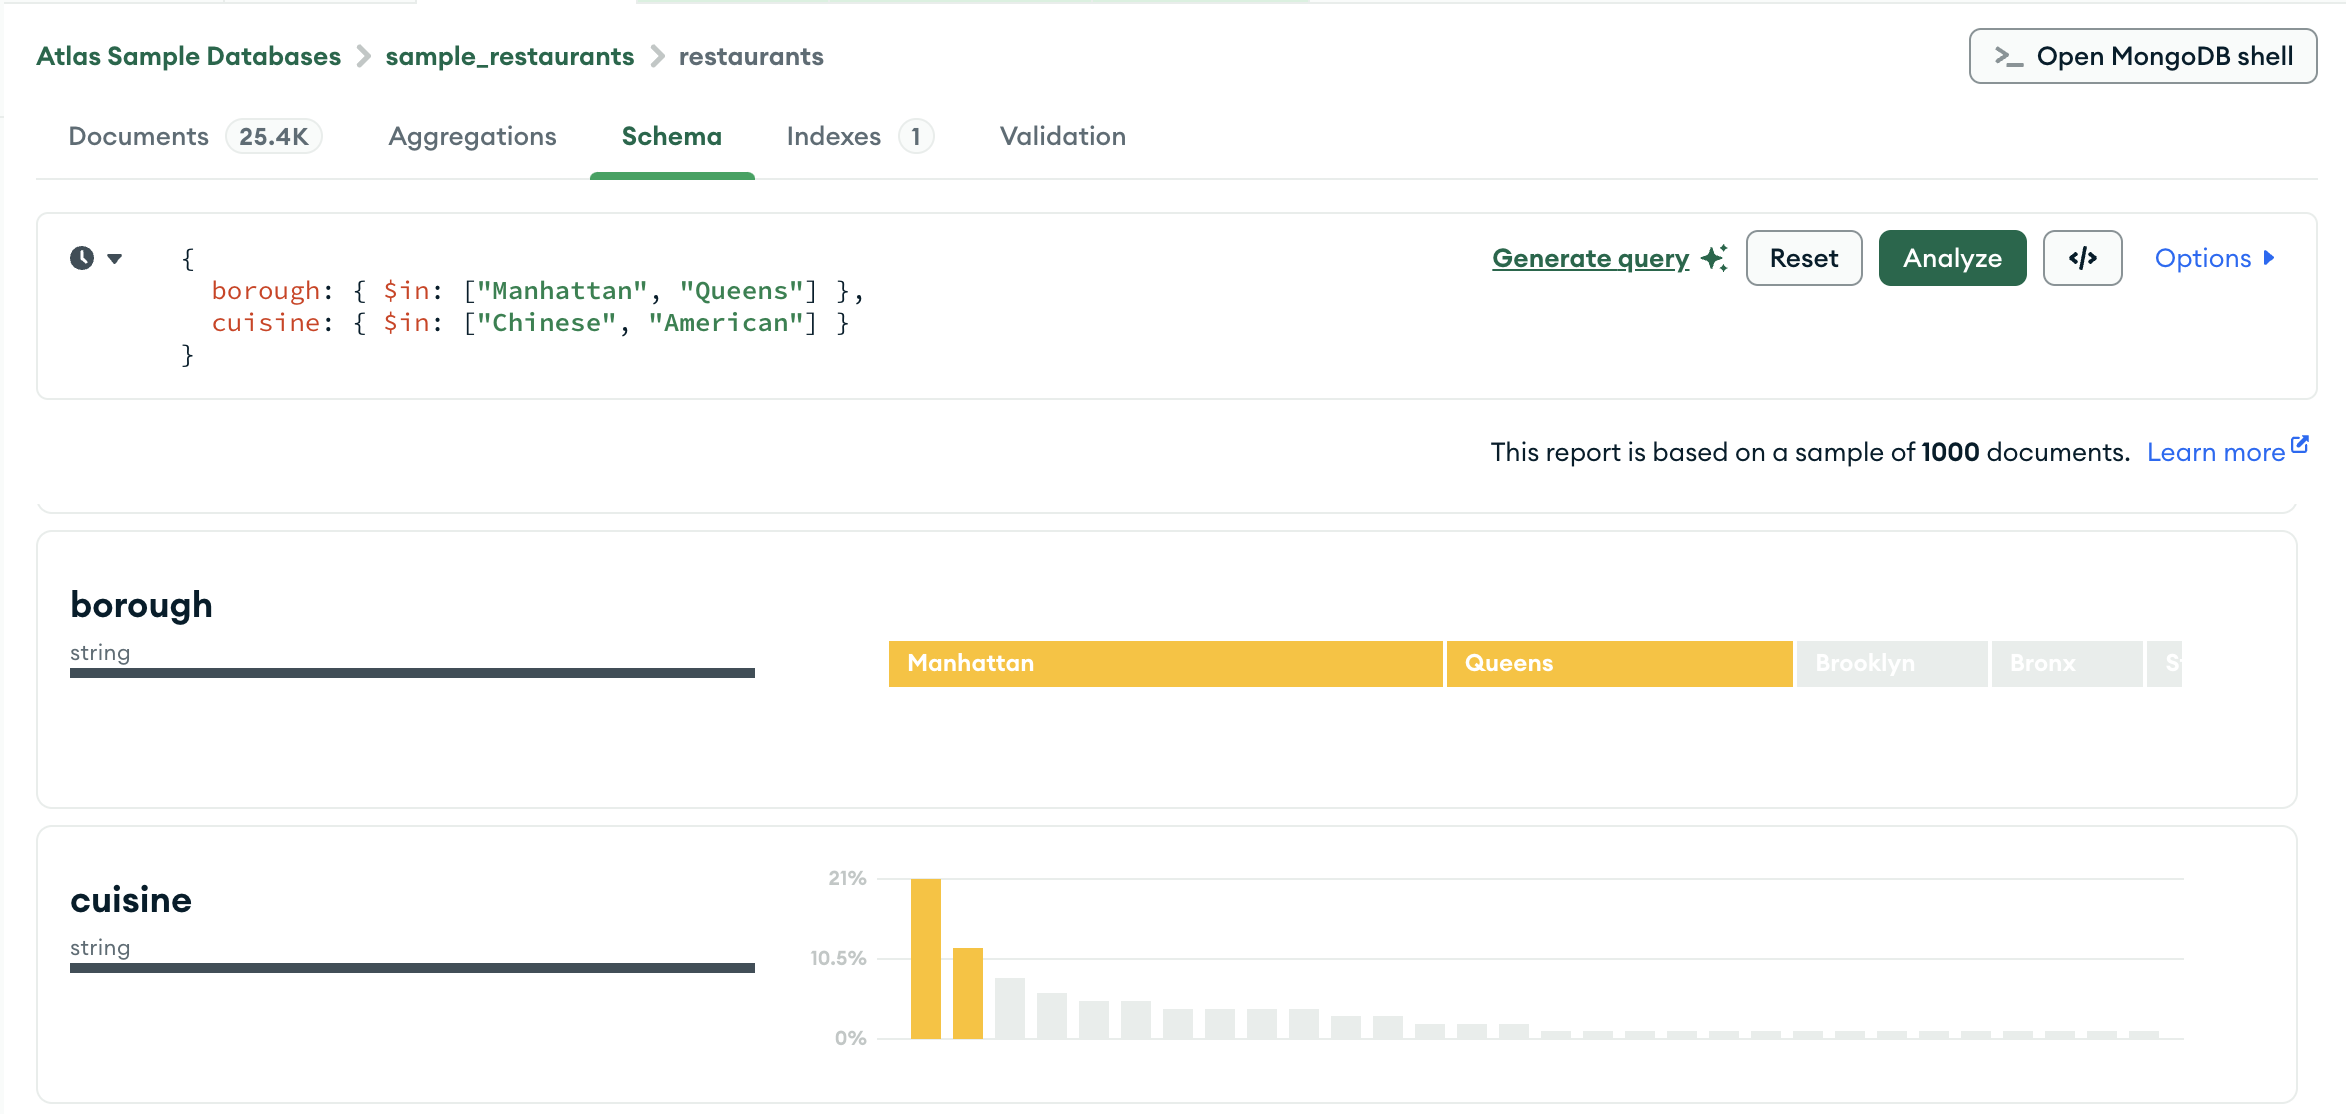
In the Schema tab, you can type the filter manually into the query bar or generate the filter with the Compass query builder. 在“架构”选项卡中,可以在查询栏中手动键入筛选器,也可以使用Compass查询生成器生成筛选器。The query builder allows you to select data elements from one or more fields in your schema and construct a query matching the selected elements.查询生成器允许您从架构中的一个或多个字段中选择数据元素,并构造与所选元素匹配的查询。
Tip
You can compose the initial query filter by using the clickable query builder and then manually edit the generated filter to your exact requirements.您可以使用可点击的查询生成器来组成初始查询筛选器,然后根据您的确切需求手动编辑生成的筛选器。
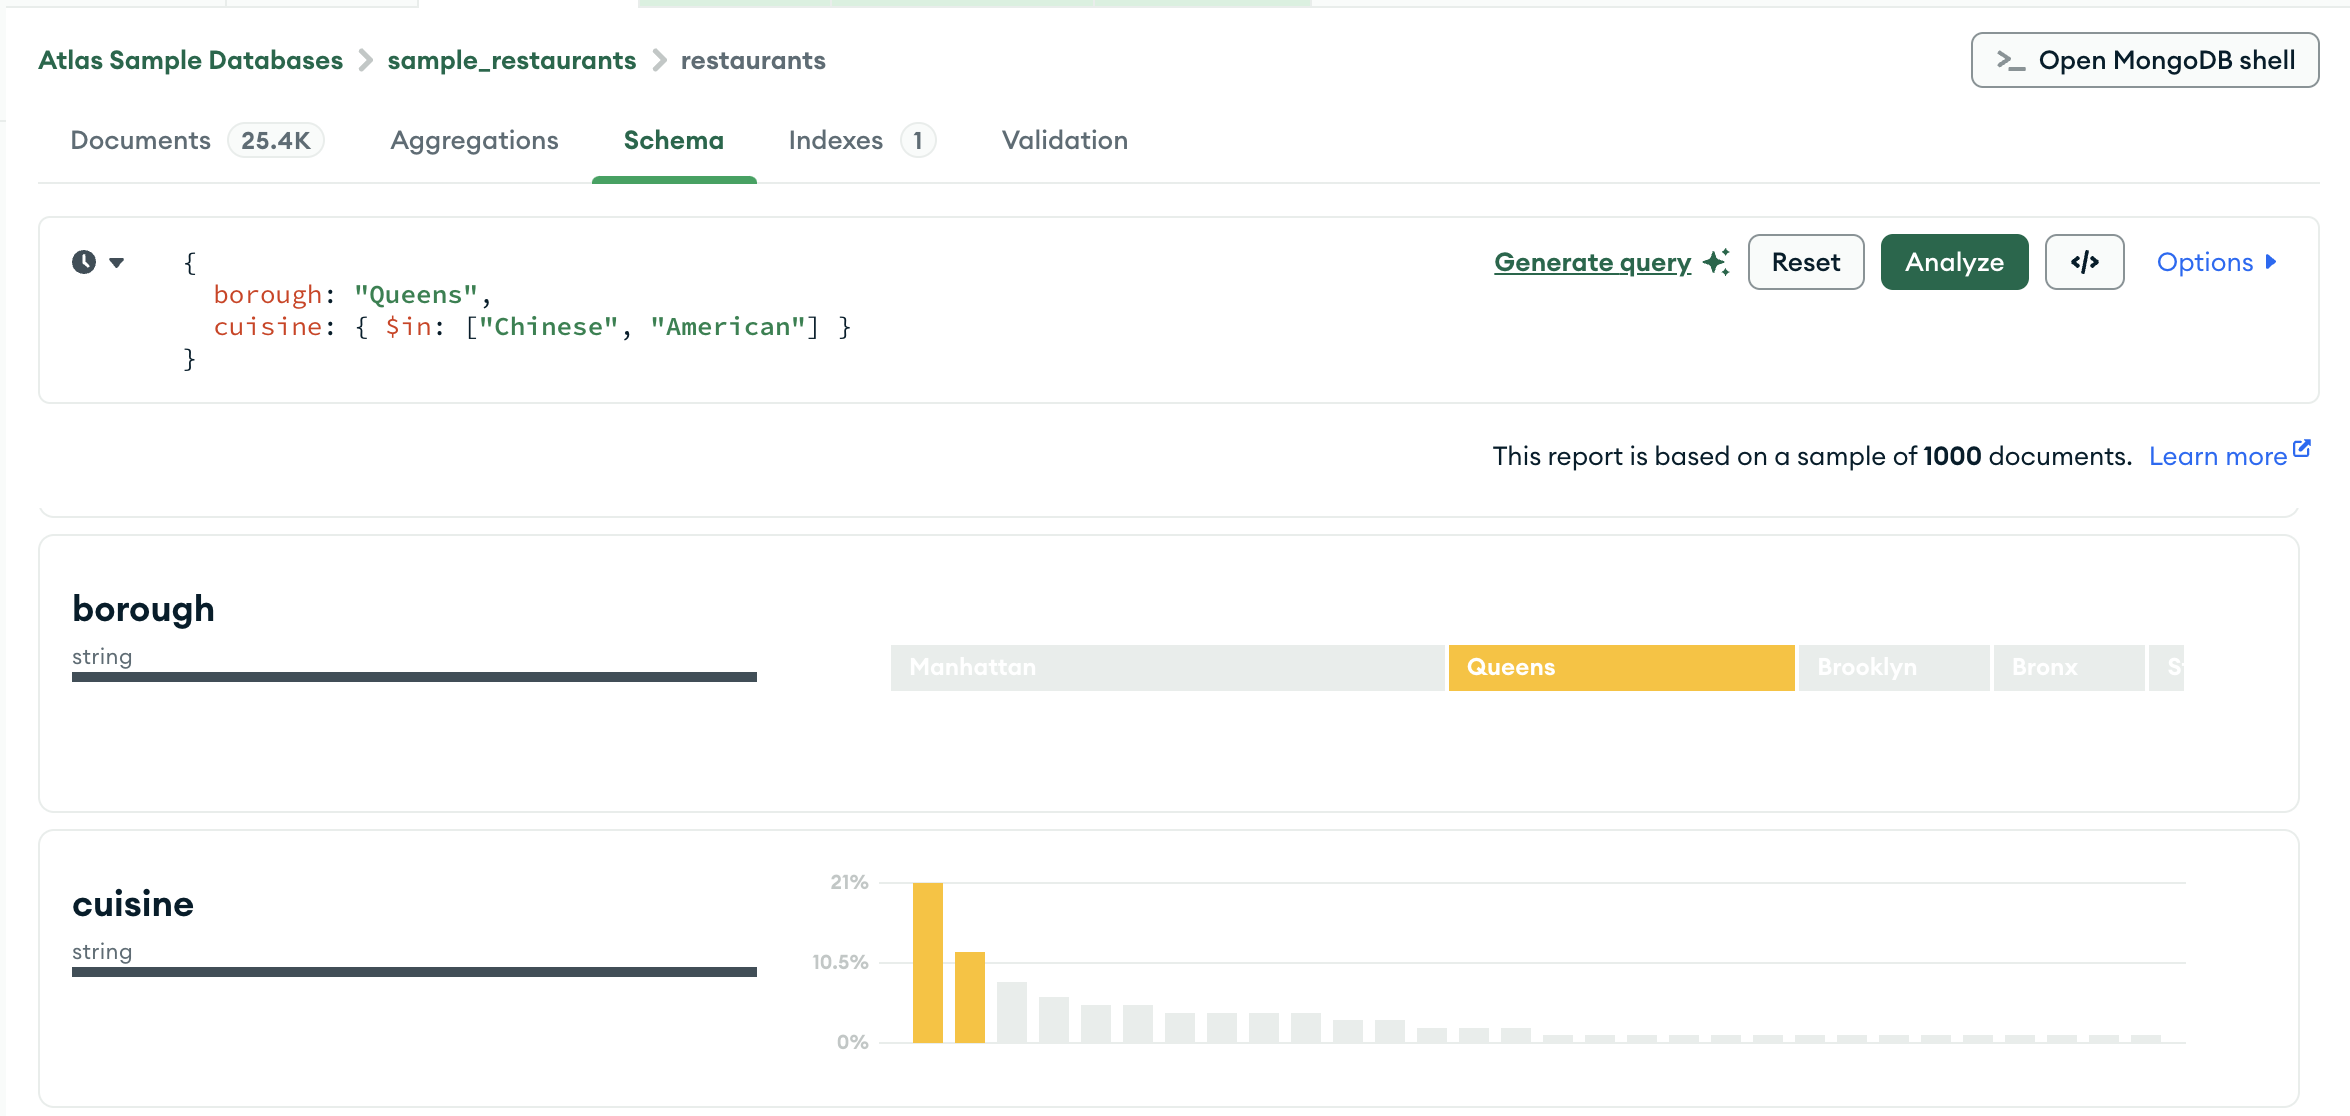
The following procedure describes the steps involved in building a complex query with the query bar.以下过程描述了使用查询栏构建复杂查询所涉及的步骤。
Analyze Location Data分析位置数据
In the Schema tab, you can use interactive maps to filter and analyze location data. 在“模式”选项卡中,可以使用交互式地图来筛选和分析位置数据。If your field contains GeoJSON data or 如果您的字段包含GeoJSON数据或[longitude,latitude] arrays, the Schema tab displays a map containing the points from the field. The data type for location fields is coordinates.[longitude,latitude]数组,则“架构”选项卡会显示一个包含字段中的点的地图。位置字段的数据类型为坐标。
Apply a Location Filter应用位置筛选器
You can apply a filter to the map to only analyze a specific range of points. 您可以对地图应用筛选器,以仅分析特定范围的点。To define a location filter:要定义位置筛选器,请执行以下操作:
Click the Circle button at the top-right of the map.单击地图右上角的“圆形”按钮。Click and drag on the map to draw a circle containing the area of the map you want to analyze.单击并拖动地图以绘制一个包含要分析的地图区域的圆。Repeat this process as desired to include additional areas of the map in the schema analysis.根据需要重复此过程,以便在模式分析中包括地图的其他区域。
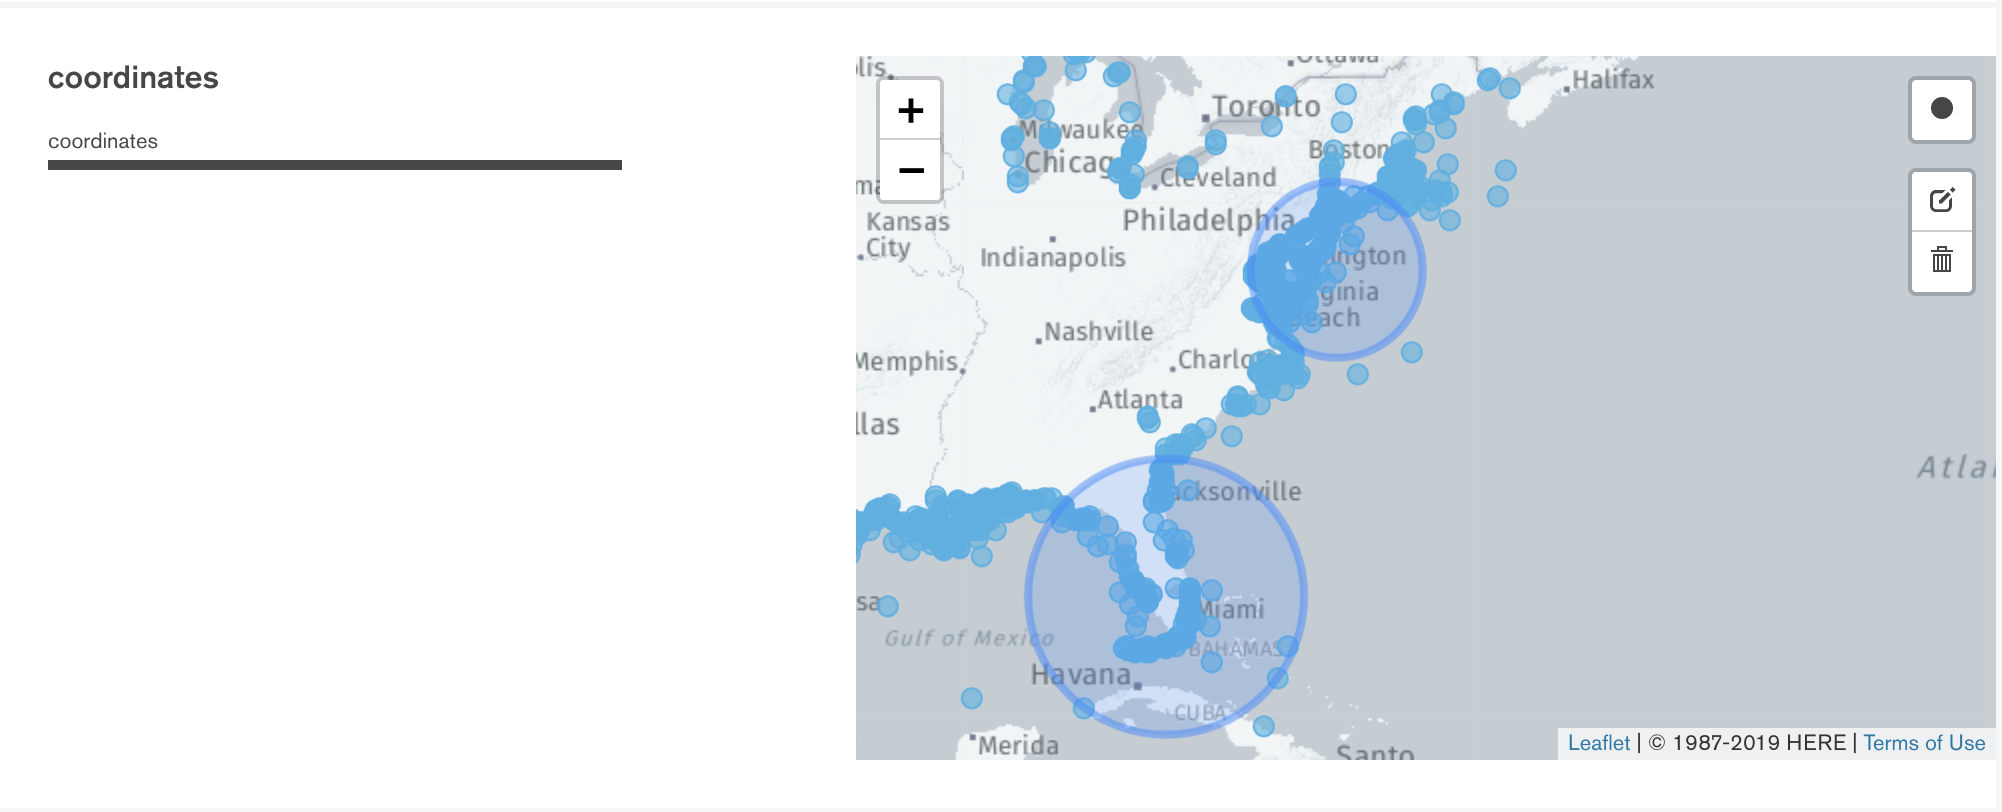
The query bar updates as you draw location filters to show the exact coordinates used in the $geoWithin query applied to the schema analysis.在绘制位置筛选器时,查询栏会更新,以显示应用于架构分析的$geoWithin查询中使用的确切坐标。
If you specify multiple location filters, the query becomes an $or query with multiple 如果指定多个位置筛选器,则查询将变为具有多个$geoWithin operators.$geoWithin运算符的$or查询。
Edit a Location Filter编辑位置筛选器
To move or resize a location filter, click on the right side of the map. 要移动位置筛选器或调整其大小,请单击地图右侧的。You will enter the filter editing mode, which looks like this:您将进入筛选器编辑模式,如下所示:
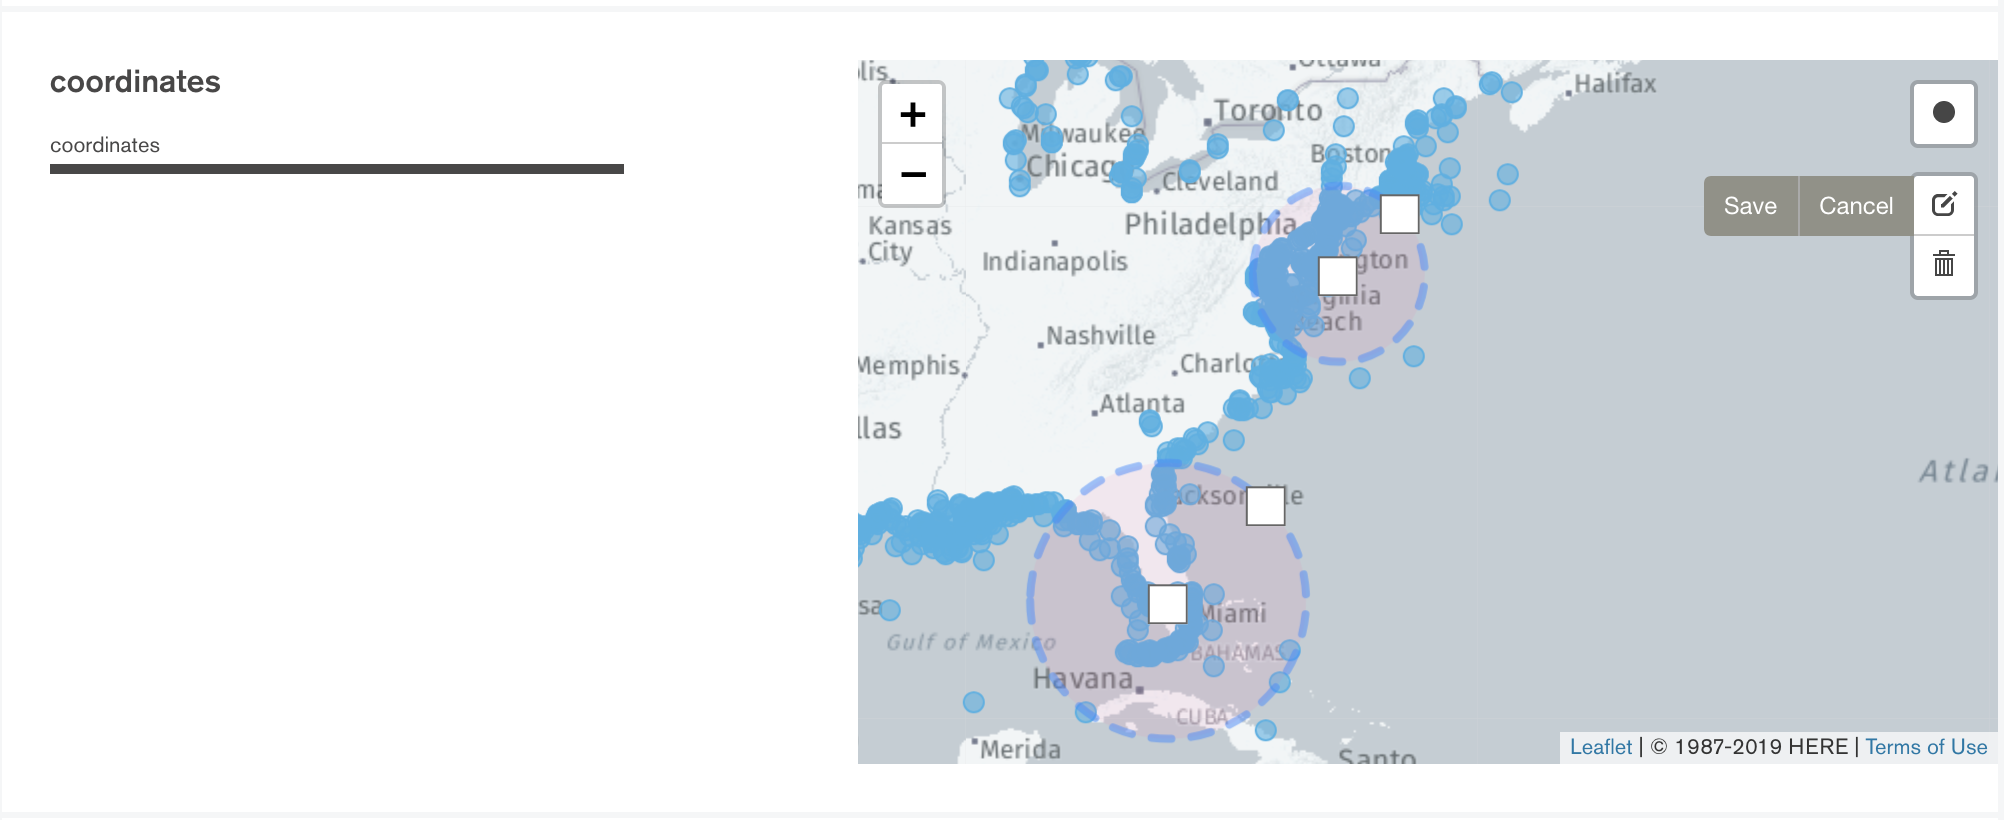
To move a filter移动筛选器Click and drag the square in the center of the circle.单击并拖动圆中心的正方形。To resize a filter调整筛选器的大小Click and drag the square at the edge of the circle.单击并拖动圆边缘的正方形。
After modifying your filters, click Save.修改筛选器后,单击“保存”。
Delete a Location Filter删除位置筛选器
To delete a location filter from the map:要从地图中删除位置筛选器,请执行以下操作:
Click on the right side of the map.单击地图右侧的。Either click:单击以下两者之一:A location filter to delete that filter.用于删除该筛选器的位置筛选器。Clear All to delete all location filters.“清除全部”以删除所有位置筛选器。
Click Save.单击“保存”。
Troubleshooting故障排除
If the analysis of your schema times out, it might be because the collection you are analyzing is very large, causing MongoDB to stop the operation before the analysis is complete. 如果您的模式分析超时,可能是因为您正在分析的集合非常大,导致MongoDB在分析完成之前停止操作。Increase the value of 增加“MAX TIME MS”的值以允许操作时间完成。MAX TIME MS to allow the operation time to complete.
To increase the value of MAX TIME MS:要增加“MAX TIME MS”的值:
In the query bar, expand Options.在查询栏中,展开“选项”。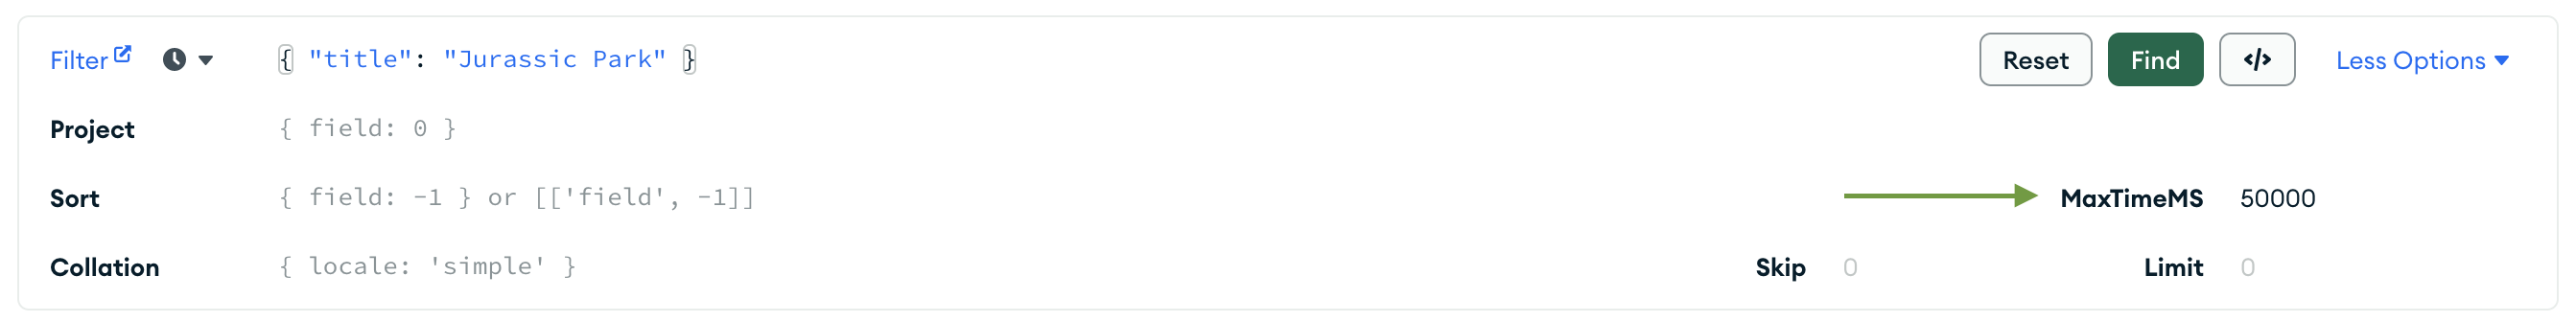
Increase the value of MAX TIME MS to accommodate your collection.增加“MAX TIME MS”的值以适应您的集合。MAX TIME MS defaults to 60000 milliseconds, or 60 seconds, but large collections might take tens of seconds to analyze.“MAX TIME MS”默认为60000毫秒,即60秒,但大型集合可能需要数十秒才能进行分析。
Once you have increased the value of MAX TIME MS, retry your schema analysis by clicking Analyze.一旦增加了“MAX TIME MS”的值,请单击“分析”重试模式分析。