To help you better understand the performance of your query, you can view your query's explain plan.为了帮助您更好地了解查询的性能,您可以查看查询的解释计划。
About This Task关于此任务
On the Explain Plan modal, you can view the explain stages as a Visual Tree, where each query operation appears as a node on the tree. You can also view the explain details in raw JSON format by selecting the Raw Output view.在“解释计划”模式中,您可以将解释阶段视为可视化树,其中每个查询操作都显示为树上的节点。您还可以通过选择“原始输出”视图以原始JSON格式查看解释详细信息。
Note
To learn more about your query through AI-powered guidance, use the MongoDB assistant.要通过人工智能指导了解有关查询的更多信息,请使用MongoDB助手。
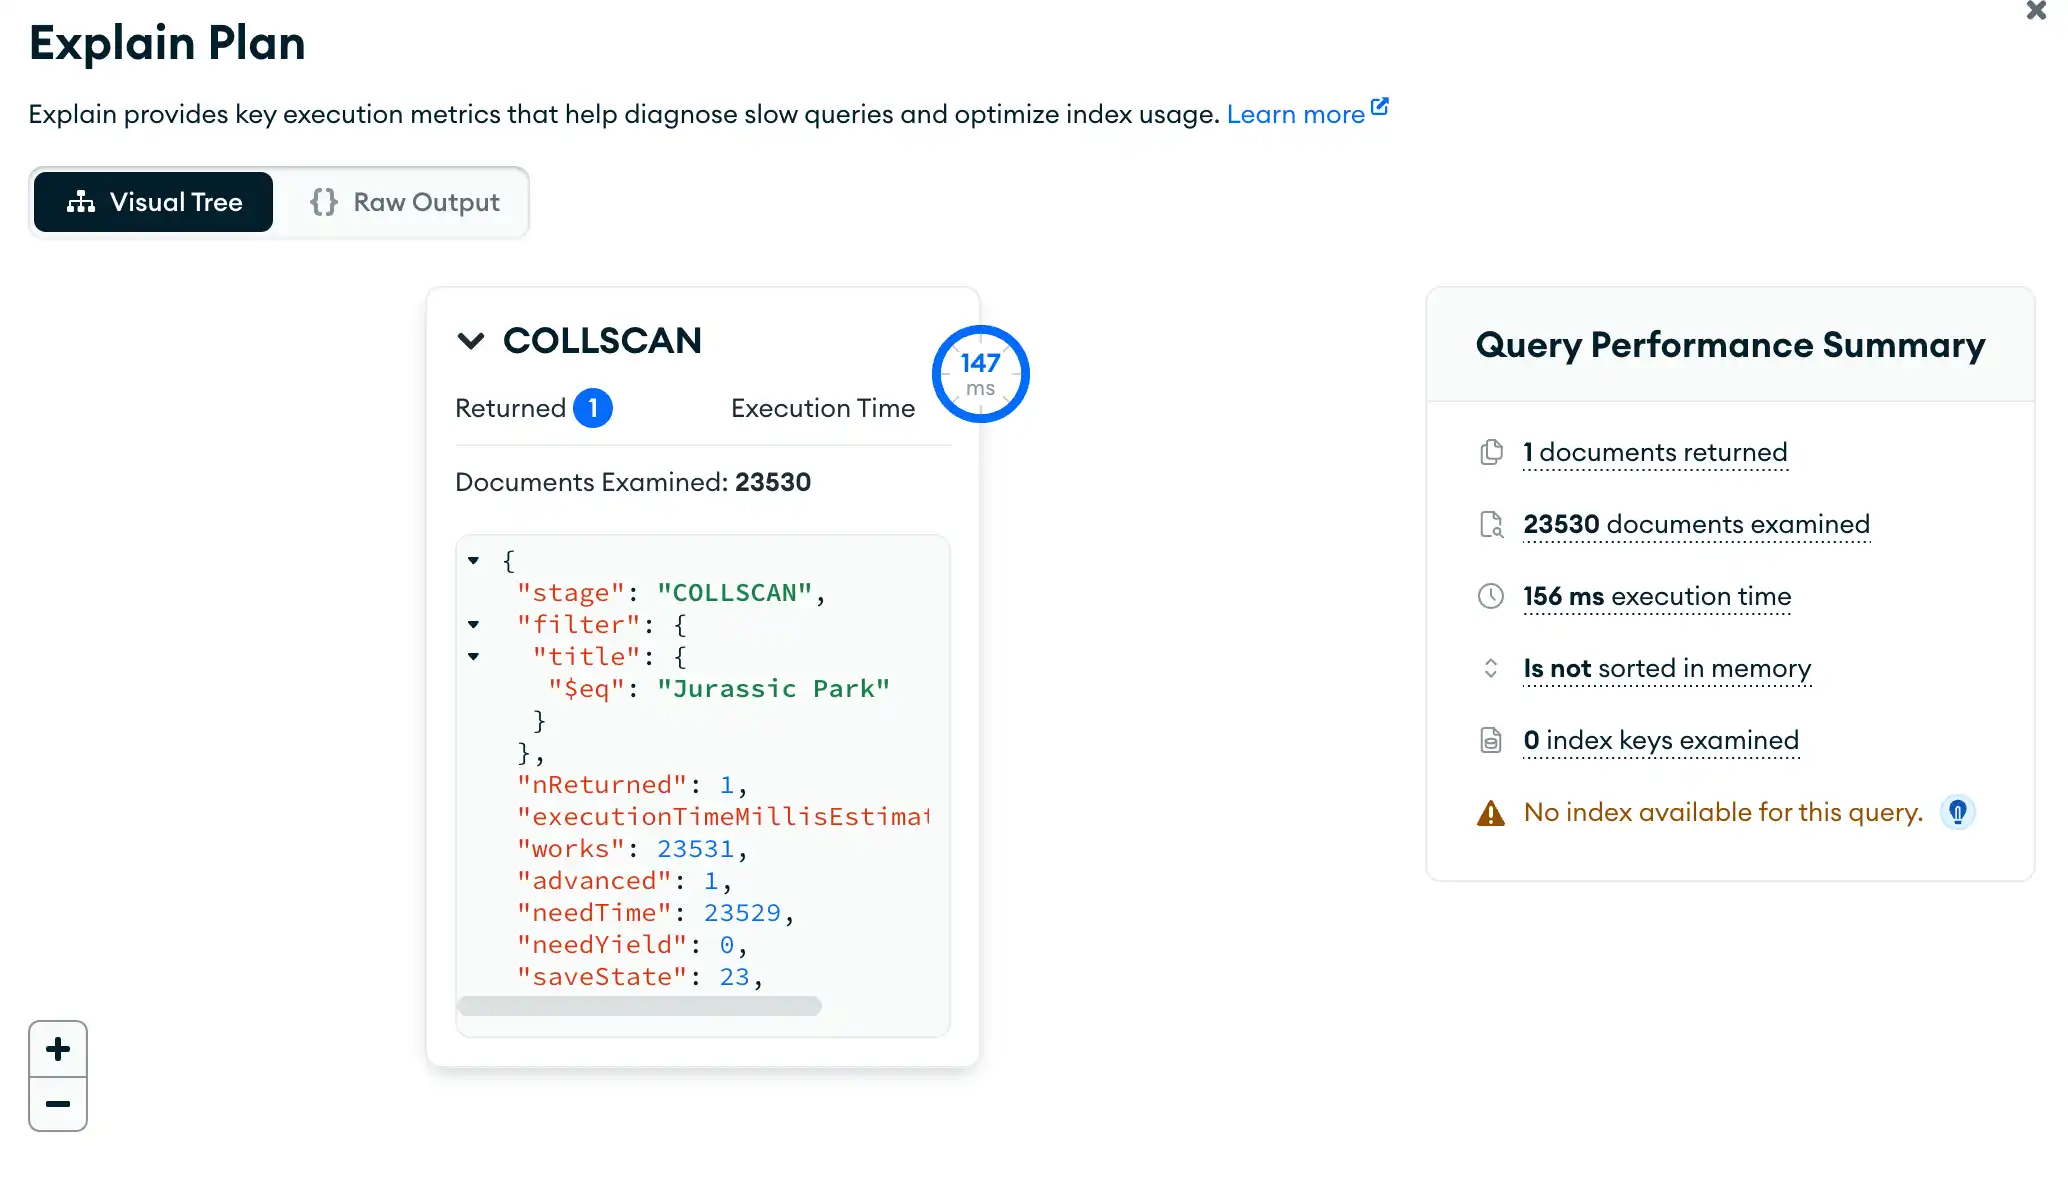
The explain plan includes a Query Performance Summary with information on the execution of your query such as:解释计划包括一个“查询性能摘要”,其中包含有关查询执行的信息,例如:
Execution time执行时间The number of returned documents退回的文件数量The number of examined documents审查的文件数量The number of examined index keys检查的索引键的数量
Note
You cannot view vector search queries in Visual Tree format.您无法以Visual Tree格式查看矢量搜索查询。
Steps步骤
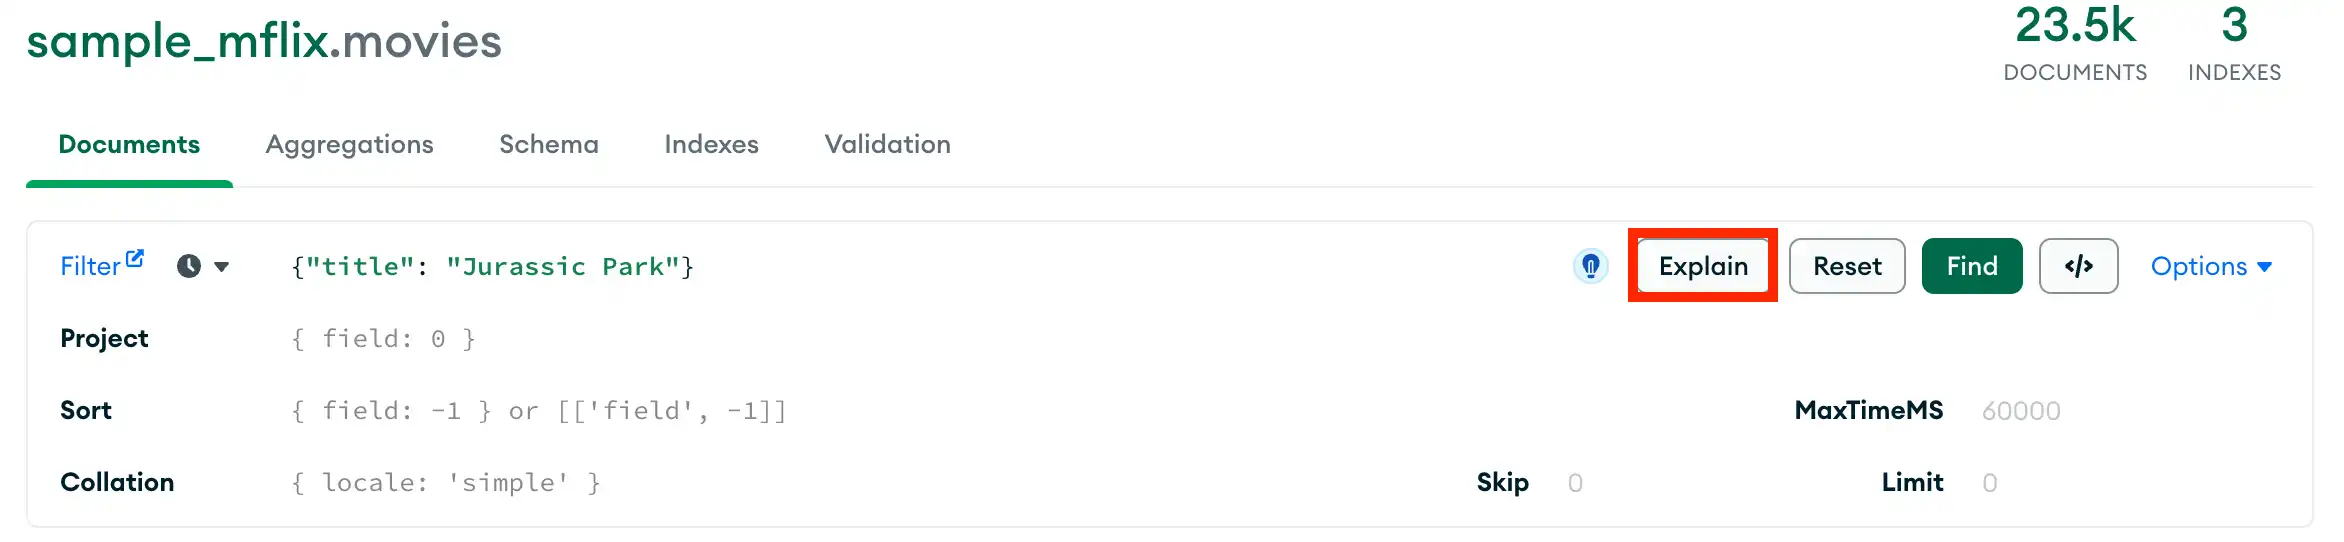
Click Explain单击“解释”
In the query bar, click the Explain button to open the modal.在查询栏中,单击“解释”按钮打开模式。
Select a query operation选择查询操作
By default, the explain stages are are shown as a Visual Tree. Each query operation appears as a node on the tree.默认情况下,解释阶段显示为“可视化树”。每个查询操作都显示为树上的一个节点。
For more detailed execution information about the query operation, click the corresponding node.有关查询操作的详细执行信息,请单击相应节点。
For example, the following explain plan provides detailed information on a query that filters for 例如,以下解释计划提供了有关筛选{ title : "Jurassic Park" }:{ title : "Jurassic Park" }的查询的详细信息: