To access the real-time server performance view, click the next to the connection name in the Connections Sidebar and select the Performance menu option.要访问实时服务器性能视图,请单击“连接”侧边栏中连接名称旁边的省略号,然后选择“性能”菜单选项。
Limitations局限性
MongoDB Compass cannot retrieve performance data for collections that use Queryable Encryption.MongoDB Compass无法检索使用可查询加密的集合的性能数据。MongoDB Compass shows limited performance data when connected to aMongoDB Compass在连接到mongos.mongos时显示有限的性能数据。
Server Stats服务器统计信息
The Performance tab displays various stats:“性能”选项卡显示各种统计数据:
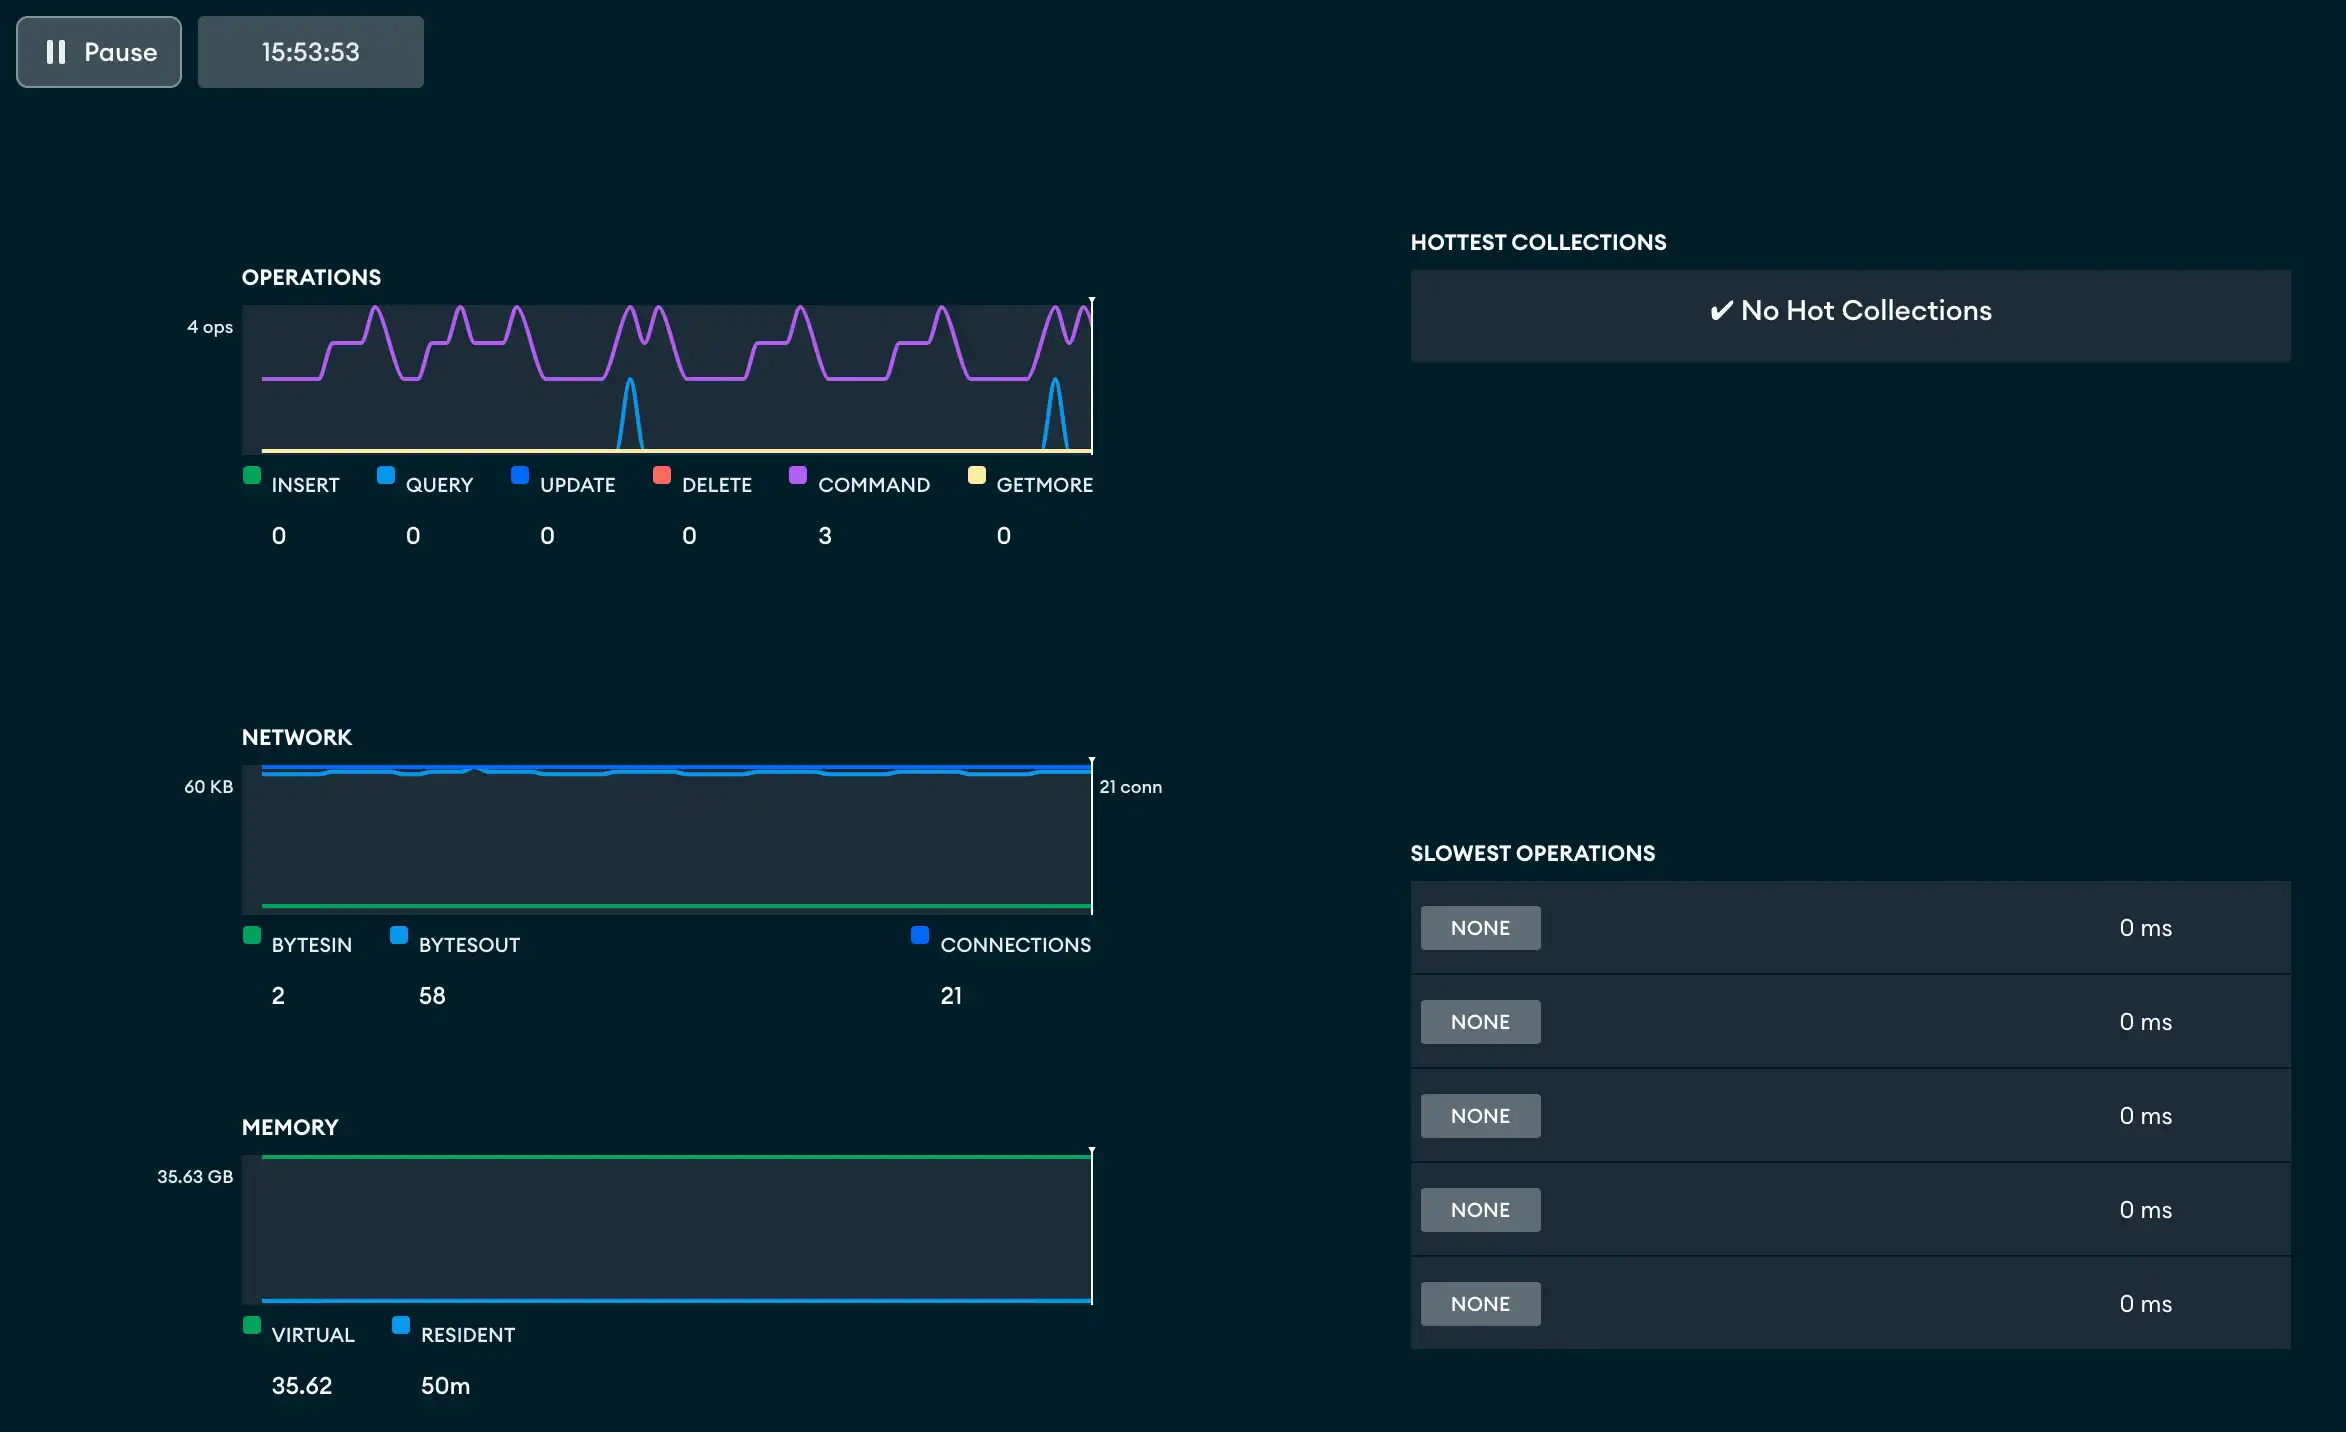
| Operations(操作) | mongostat. mongostat报告的操作数。mongostat.mongostat。 |
| Read & Write(读和写) | mongostat. For a description of the fields, see mongostat.mongostat报告的活动读取、排队读取、活动写入、排队写入的数量。有关字段的描述,请参阅mongostat。 |
| Network(网络) | mongostat. For a description of the fields, see mongostat.mongostat报告的连接数。有关字段的描述,请参阅mongostat。 |
| Memory(内存) | mongostat. For a description of the fields, see mongostat.mongostat报告的内存统计信息。有关字段的描述,请参阅mongostat。 |
| Hottest Collections(最热集合) |
|
| Slowest Operations(慢操作) | db.currentOp()报告的最慢操作。这些操作对应于图表中的给定时刻;即,当您在图表上移动时,表中会显示相应的最慢操作。 |
Stop Slow Operations停止慢速操作
You can stop slow operations from the Performance Tab.您可以从“性能”选项卡停止慢速操作。
Important
Required Permissions必需的权限
On deployments that require authentication, to stop operations that you don't own, you must have the 在需要身份验证的部署中,要停止您不拥有的操作,您必须具有killop privilege action.killop权限操作。
Pause the Display暂停显示
The Pause button above the graph display pauses the update of the displays only. Pausing the performance tab does not impact the collection of the underlying data. To restart the display updates, click Play.图形显示上方的“暂停”按钮仅暂停显示的更新。暂停性能选项卡不会影响基础数据的集合。要重新启动显示更新,请单击“播放”。
Next to the Pause button is a clock which shows the current time while the graphs are updating. If the display is paused, the clock shows the time at which the pause began.暂停按钮旁边是一个时钟,在图形更新时显示当前时间。如果显示暂停,时钟将显示暂停开始的时间。