To help you better understand the performance of your pipeline, you can view your pipeline's explain plan. You can view the explain plan at any point while creating or editing your pipeline.为了帮助您更好地了解管道的性能,您可以查看管道的解释计划。在创建或编辑管道时,您可以随时查看解释计划。
About this Task关于此任务
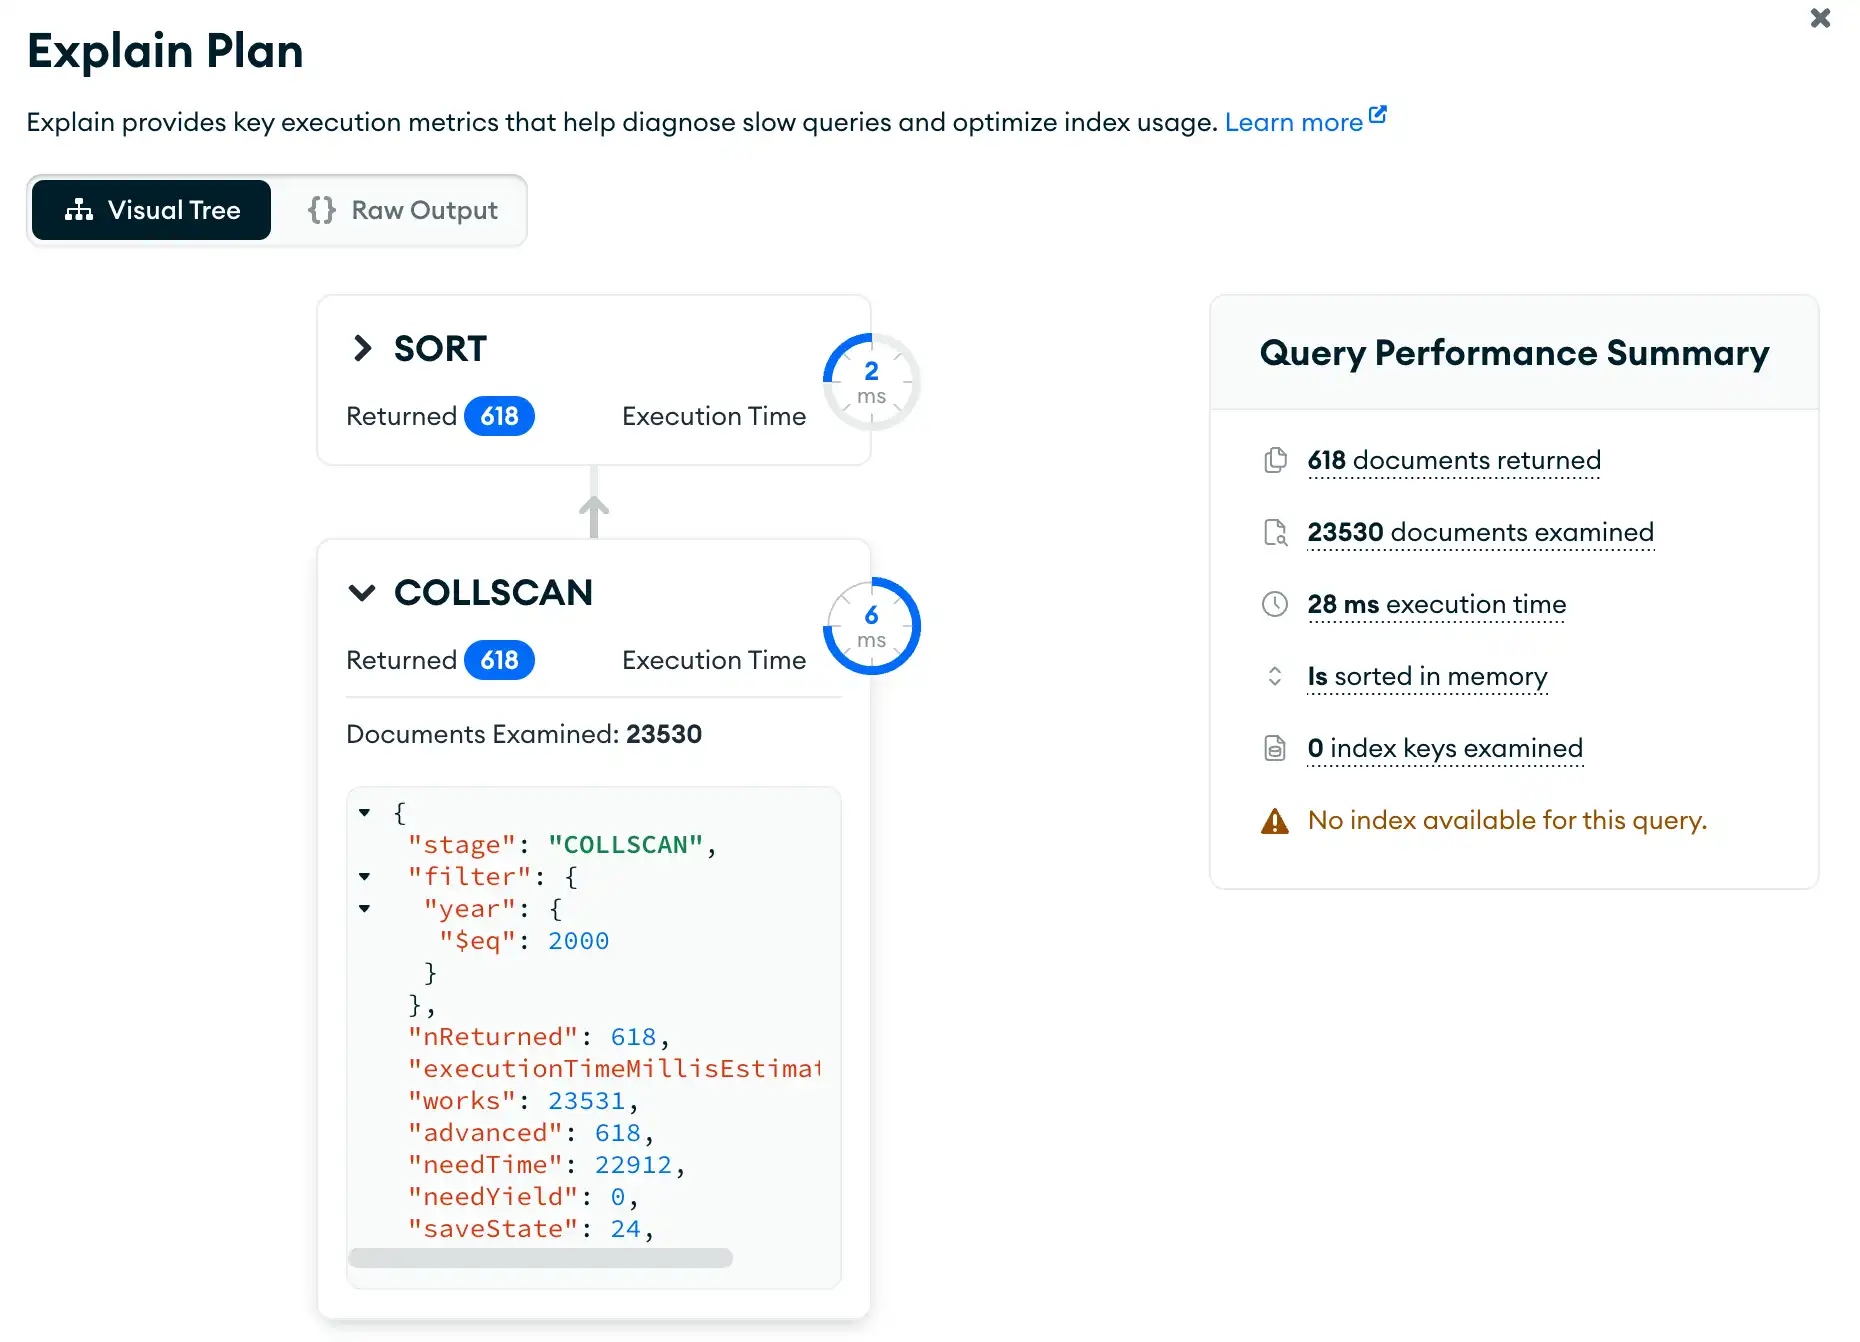
On the Explain modal, you can view the explain stages as a Visual Tree, where each stage of the pipeline appears as a node on the tree. Alternatively, you can view the explain details in raw JSON format by selecting the Raw Output view.在“解释”模式中,您可以将解释阶段视为“可视化树”,其中管道的每个阶段都显示为树上的节点。或者,您可以通过选择“原始输出”视图以原始JSON格式查看解释详细信息。
The explain plan includes a Query Performance Summary with information on the execution of your aggregation pipeline such as:解释计划包括一个“查询性能摘要”,其中包含有关聚合管道执行的信息,例如:
Execution time执行时间The number of returned documents退回的文件数量The number of examined documents审查的文件数量The number of examined index keys检查的索引键的数量
Steps步骤
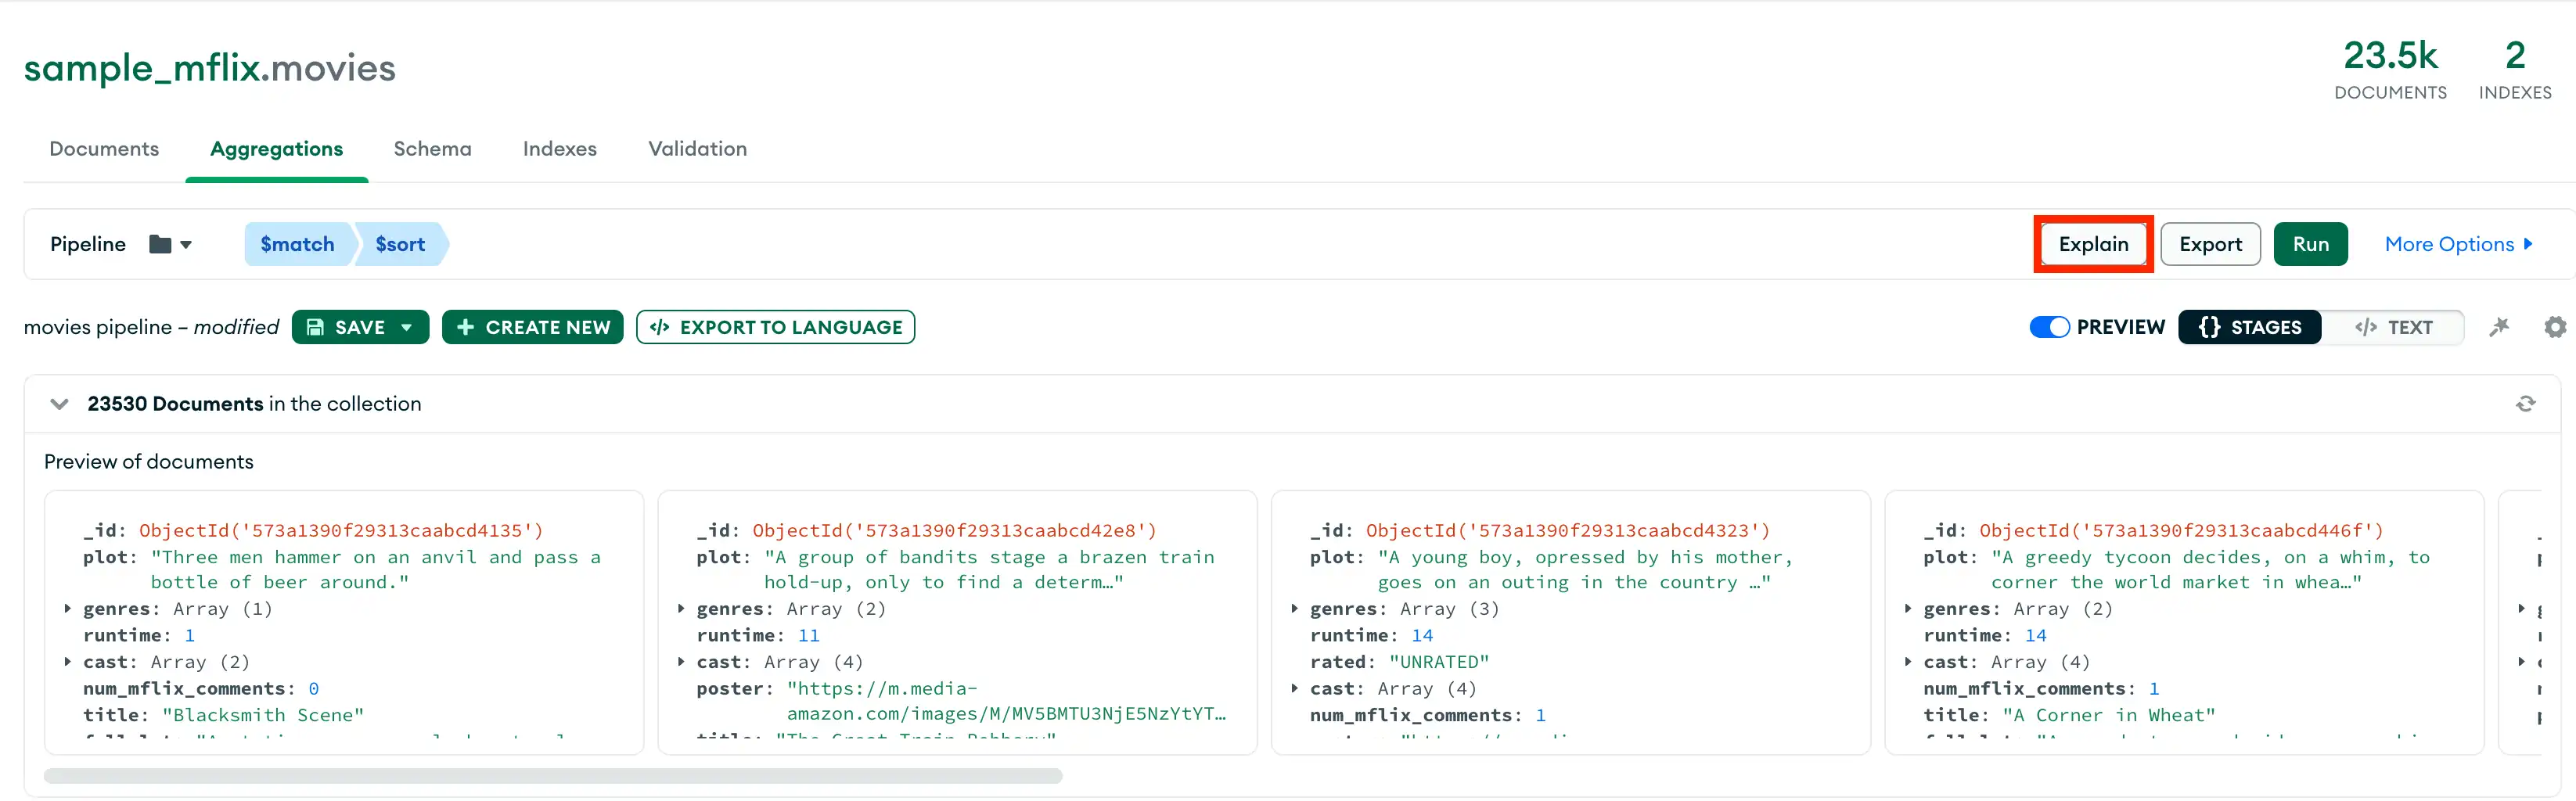
Click Explain单击“解释”
In the top right of the aggregation pipeline builder, click the Explain button to open the Explain Plan modal.在聚合管道生成器的右上角,单击“解释”按钮打开“解释计划”模式。
Select an aggregation pipeline选择聚合管道
By default, the explain stages are are shown as a Visual Tree. Each stage of the pipeline appears as a node on the tree.默认情况下,解释阶段显示为“可视化树”。管道的每个阶段都显示为树上的一个节点。
You can click on each stage for more detailed execution information about the stage.您可以单击每个阶段以获取有关该阶段的更详细的执行信息。